Nvidia is the Bo Jackson of the stock market
122% revenue growth and a 55% net profit margin. Almost as good as being named an All-Star in two different professional sports.
It’s hard to do it all; to be both fast and strong, traditional and modern, good at baseball and football.
Companies are similar. At any one time they tend to offer investors one of two things: profits today, or profits tomorrow.
But, occasionally in life, there are exceptions to rules. Like Bo Jackson.
Bo is the only professional athlete in history to be named an All-Star in two major North American sports. He got picked by the New York Yankees in the 1982 draft, but decided to go to Auburn University instead, where he ended up playing both baseball and football, winning the Heisman trophy in 1985 (awarded to the most outstanding player in college football).
After college, he did the reverse… turning down a $7 million NFL contract from Tampa Bay to play baseball instead. He joined the Kansas City Royals in 1986, kickstarting a baseball career that would see him named an All-Star. He also played in the NFL for the Raiders for four of those years (1987-1990), scoring 16 touchdowns. A hip injury from 1991 led to his eventual retirement before the 1995 season began.
Nvidia’s latest results, for which expectations were understandably sky high, delivered the rarest of things: both outlandish sales growth and profit margins. This was broadly priced in, but it doesn’t change the fact that the fundamental numbers reported were remarkable for a company its size (or indeed, any size). In fact, in its latest quarter, the company notched revenue growth of 122%, with a net profit margin that, over the last 4 quarters, has clocked in at an impressive 55%.
Let’s try and give that result some context.
One popular rule of thumb for venture capital investors, popularized by Brad Feld, is “The Rule of 40%” — that your revenue growth and profit margin should add up to 40%. So, if your company is growing at 30%, it should also be making at least a 10% profit margin. If you’re not growing at all, you need to at least be heavily profitable (40% margin). It’s a helpful heuristic to gauge whether a startup is on the right track, and the endless trade-off between growth and profitability.
So, how does Nvidia compare to its S&P 500 peers on that metric? Unsurprisingly — even though the rule was designed for startups, not $3 trillion behemoths — it does very well: 122% + 55% = 177%.
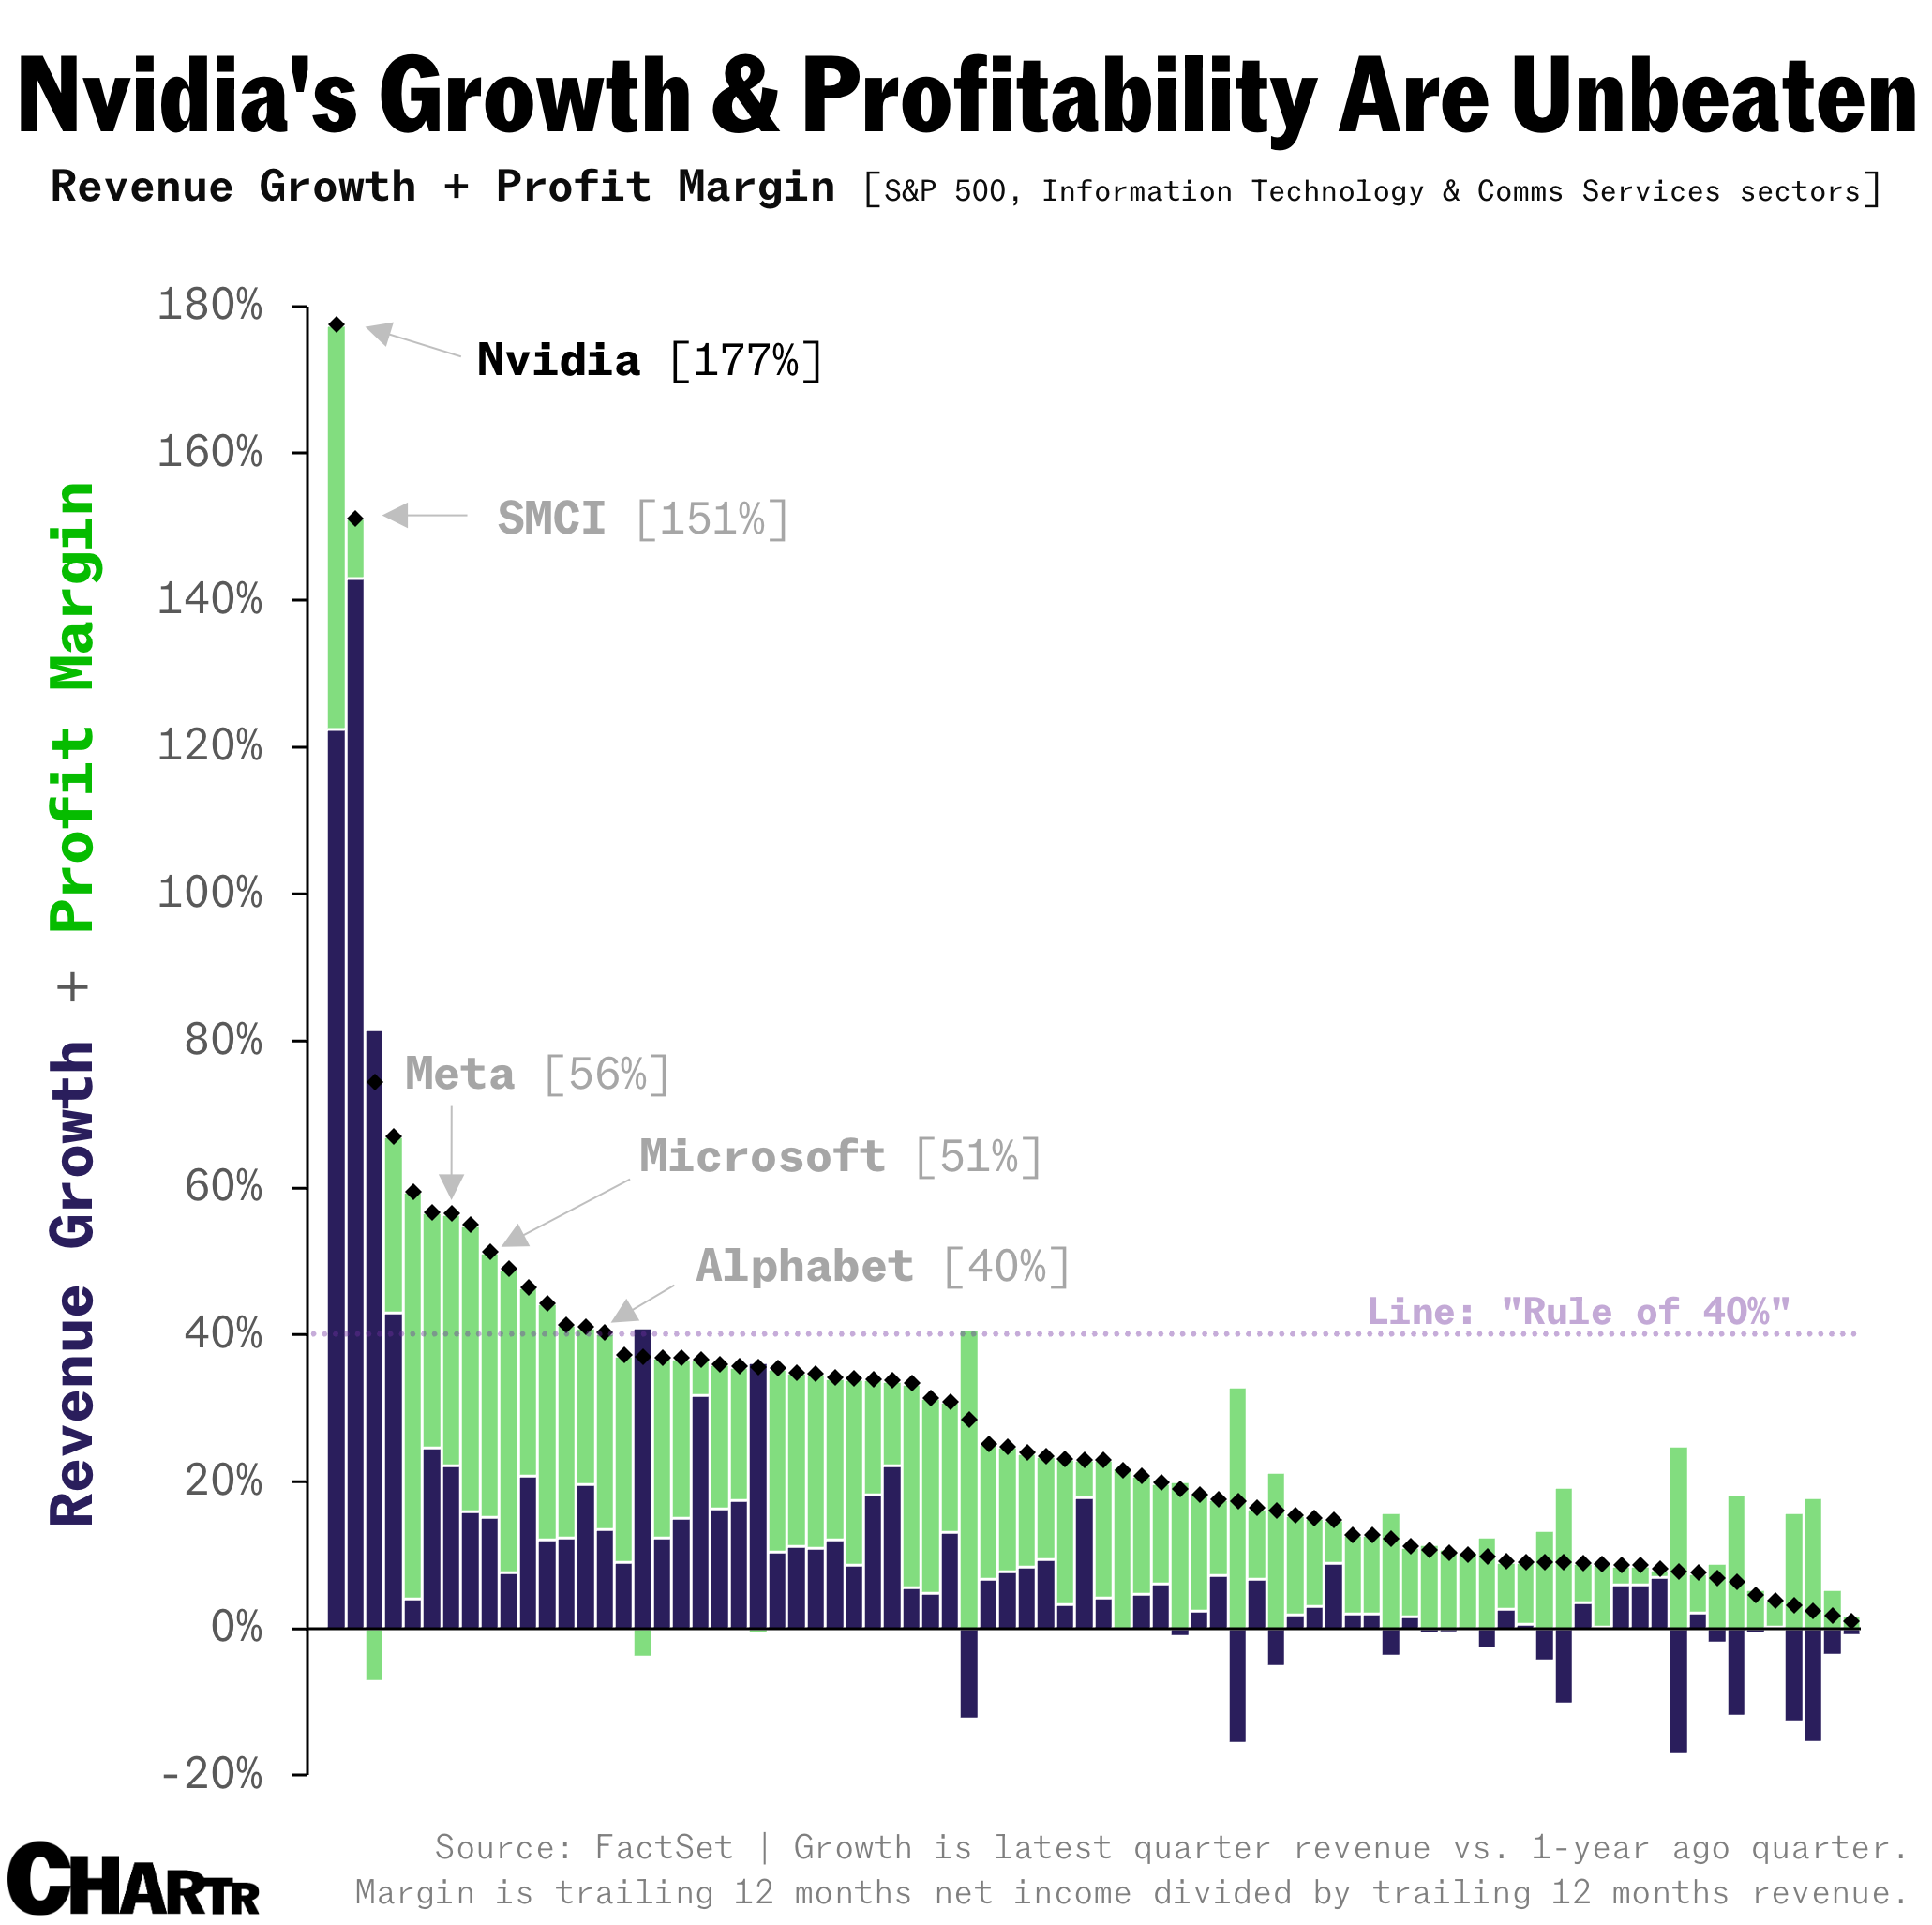
On that measure, 15 out of the 88 members of the Information Technology and Communication Services sectors of the S&P 500 meet that “Rule of 40%” threshold. Nvidia is head and shoulders above its peers.
Bo knows
But, simply adding two numbers together — while a really helpful rule of thumb that we can calculate quickly — somewhat distorts our search for companies that are exceptional on both growth and margins — i.e., a company can have one glaring weakness, but make up for it by the other metric.
Another drawback of simple addition is that, statistically speaking, the variance of revenue growth is generally wider than the variance in margins and the average margin is roughly double that of sales growth. Hence the addition formula tends to “over-reward” growth for really high growth companies, but “over-reward” margins in general.
To fix that, we can multiply the numbers together, instead of adding them. Let’s consider an example of two companies, one is growing at 35% a year with a 5% margin. So, it meets the “Rule of 40” (just). The other is growing just a tiny bit slower, but at double the margin! Under the addition rule, they score the same. By multiplying, Sweets Inc. scores much higher.

We’ll call this the Bo Jackson Index. These are the stocks that can play both games: growing fast and making bank. In short, it’s hard to score highly on the Bo Jackson Index if there’s too large a gap between the two variables. Here’s what it looks like for Nvidia and its peers in the S&P 500.
On this measure, of companies that are growing and making profits, the typical score is 83 (median). The average is 171. Apple scores 129, with ~5% growth and a ~26% margin. Microsoft manages an impressive 546. Meta ranks 10th with a score of 759, thanks to its healthy revenue growth of ~22% and margin of ~34%. Nvidia scores 6,737.
It’s gonna get harder
As Nvidia begins to lap harder and harder comparable quarters, that figure is undoubtedly going to come down. But, for now, it’s worth putting into context just how rare it is for any company to have added $16.5 billion in revenue in a year, while maintaining a profit margin north of 50%. It’s Bo Jackson levels of unprecedented, even if it doesn’t continue.
Note: Lots of Financials stocks are doing well on the Bo Jackson Index at this moment in time, riding a wave of higher interest rates.
Methodology:
Bo Jackson Index: Revenue growth multiplied by Net Profit Margin. Example: a company with 20% revenue growth and a 10% profit margin would score 200 on the BJI.
Revenue Growth: This is calculated as the latest quarterly revenue, relative to revenue from 4 quarters ago, per FactSet.
Net Profit Margin: This is calculated as Net Income over the last 4 quarters divided by revenue over the last 4 quarters. Net Income is before Extraordinary Items/Preferred Dividends minus Discontinued Operations, per FactSet.
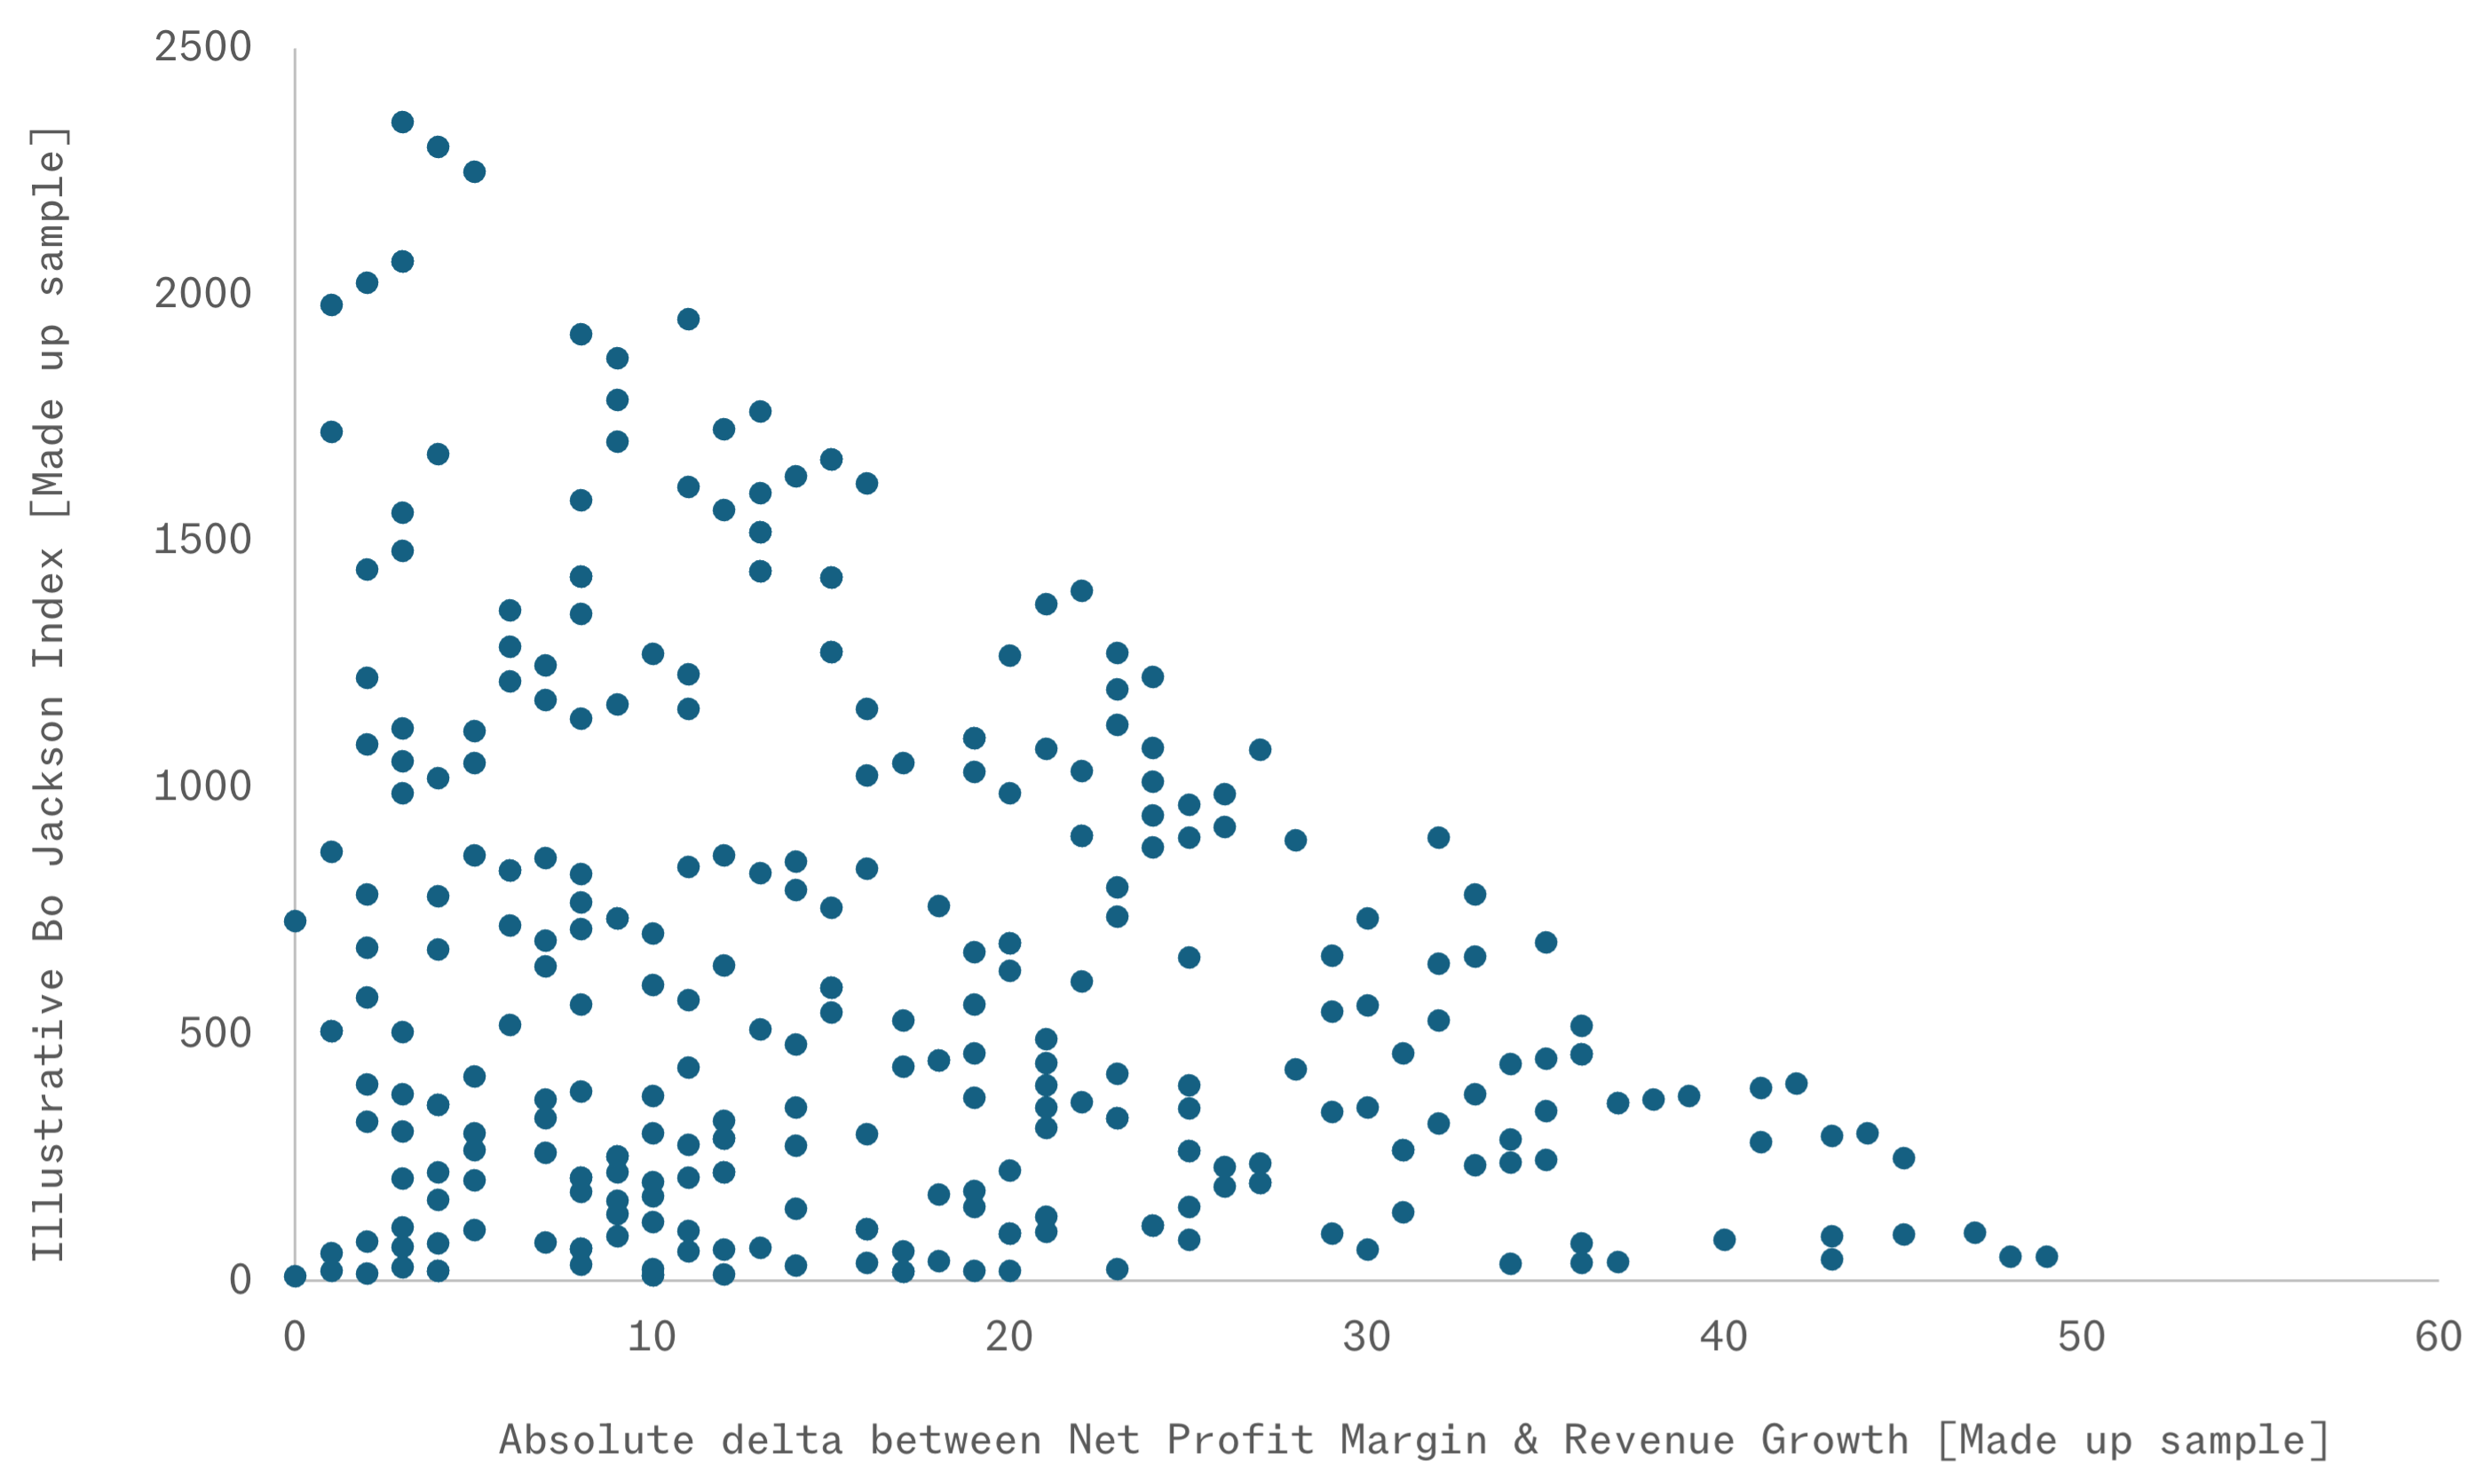
The Bo Jackson Index is just one metric, and far from perfect in assessing whether a company is growing sustainably and profitably. It is strongly correlated with the simpler “Rule of 40”, but it is mathematically harder to score highly on the BJI with a large gap between growth and margins. This scatter below plots a completely made up sample of 300 “stocks”, with random growth rates [0-50%] and margins [0-50%] to illustrate.
Thank you to Sherwood Media’s Nicholas Hirons for his help on the Bo Jackson Index.