‘Crisis pricing’ sweeps markets, mangling momentum trades as volatility spikes
The stock selloff is deepening as investors rush for the exits on popular trades.
This is what panic looks like.
On Monday, the VIX Index – which tracks the implied volatility of the S&P 500 over the next month – hit levels only exceeded during the 2008 financial crisis and as COVID spread through the Western World.
Japan’s Nikkei 225 had its worst day since 1987.
And at one point this morning, short-term rates traders priced in a more than 40% chance that the Fed would deliver a rate cut not at its September meeting, but before in an emergency unscheduled meeting before that!
“What's interesting here is that we have crisis pricing without an attendant crisis,” tweeted Guy Lebas, chief fixed income strategist and portfolio manager at Janney Montgomery
We’ve moved from a “selling because we think we should” to a “selling because we have to” market, with the S&P 500 on pace for its second loss of more than 2% in the last two weeks after having gone 356 sessions since its last one.
Two reliable trends show cracks
Friday has a clear macroeconomic catalyst to explain the stock market selloff: a weak jobs report that raised fears about the outlook for US consumption going forward. But even that day, there was an element of momentum at play: For instance, tech stocks underperformed financials, even though banks are more cyclical and would likely suffer more damage to operating performance in the event of a recession.
What do Nvidia chief Jensen Huang and Bank of Japan Governor have in common? They were both at the center of two of the most reliable, important trends in the market – the seemingly endless outperformance of AI-linked stock and upwards march in the value of the US dollar relative to the Japanese yen. Those two trends have cracked, and are retracing. Since part of their success was tied to their success – that is, people bought them because they were going up – this dynamic certainly has ample scope to reverse.
We’ve had catalysts to break each one of these trends: the mild inflation print that had investors stampede into small caps as soft landing beneficiaries, and the Bank of Japan’s interest rate hike to 0.25% just as the market began demanding an imminent and increasing amount of rate cuts from the Federal Reserve.
“It’s worth keeping in mind that a rapid appreciation of the yen, and the subsequent unwinding of carry trades, have played a role in previous periods of acute market stress, including the collapse of the hedge fund Long Term Capital Markets in 1998,” wrote analysts at Capital Economics.
It doesn’t really seem to matter that Friday’s jobs report undercut the “soft landing” narrative stateside on a fundamental basis. What’s more important, at least for now, is that momentum in these high-flying pockets of the market has definitively turned.
“What started as a fundamentally-driven, broad-based increase in equity vol on Friday has turned into a positioning-driven squeeze, with the best-performing (most crowded) regions/names getting hit the hardest,” writes Mandy Xu, head of derivatives market intelligence at Cboe Global Markets.
Those are the two most obvious “momentum” trades in the market, but those are by no means a laundry list.
“Reminder, there is still a significant amount of both hedge fund gross and systematic length in this market,” wrote Goldman Sachs managing director Brian Garrett in a note to clients on Friday.
People are panicking, but it’s not a full-blown panic
Heading into the month, Goldman analysts suggested that stock market exposure for CTAs (commodity trading advisors – generally a shorthand for trend-following funds) was in its 84th percentile relative to history, and headed down from here. To this end, Blueprint Chesapeake Multi-Asset Trend ETF has cratered in the past three sessions, turning its year-to-date gains into losses:
The good news, for now at least, is that this may be what panic looks like, but it’s not quite full-blown panic. For Austin Powers, losing his mojo was a crisis, but it needn’t be the same for markets and the economy, at least not for too long. Two key things to watch:
Even with a significant two-day jump, credit spreads on corporate bonds are closer to their 2024 tights than their 2023 wides as of 11:45am ET. This suggests investors are less worried about the kind of widespread business failures you’d see during a recession now versus March 2023, when we were digesting the potential for any contagion linked to the failure of Silicon Valley Bank.
And perhaps most importantly, look at the greenback. It’s not a real liquidity crisis until the US dollar starts going up.
During the spikes in equity market volatility amid COVID and following the failure of the bailout plan in October 2008, the US Dollar Spot Index was gaining 5%. This time, the US dollar is down 2% vs its major trading partners over the past five sessions.
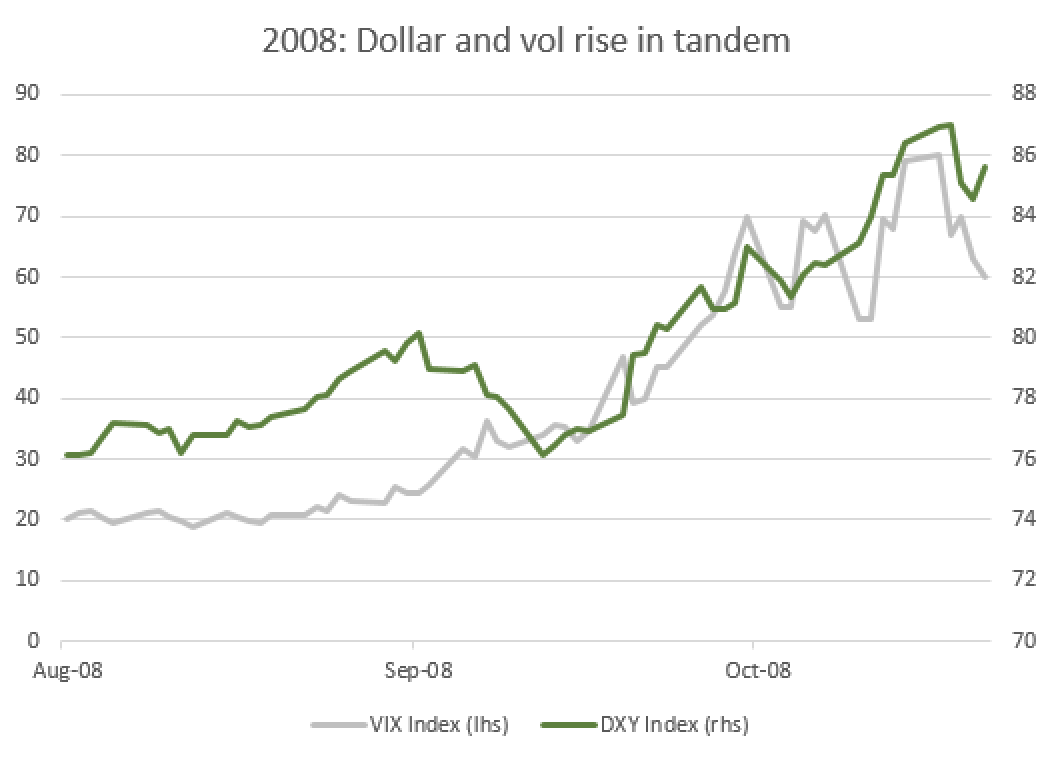
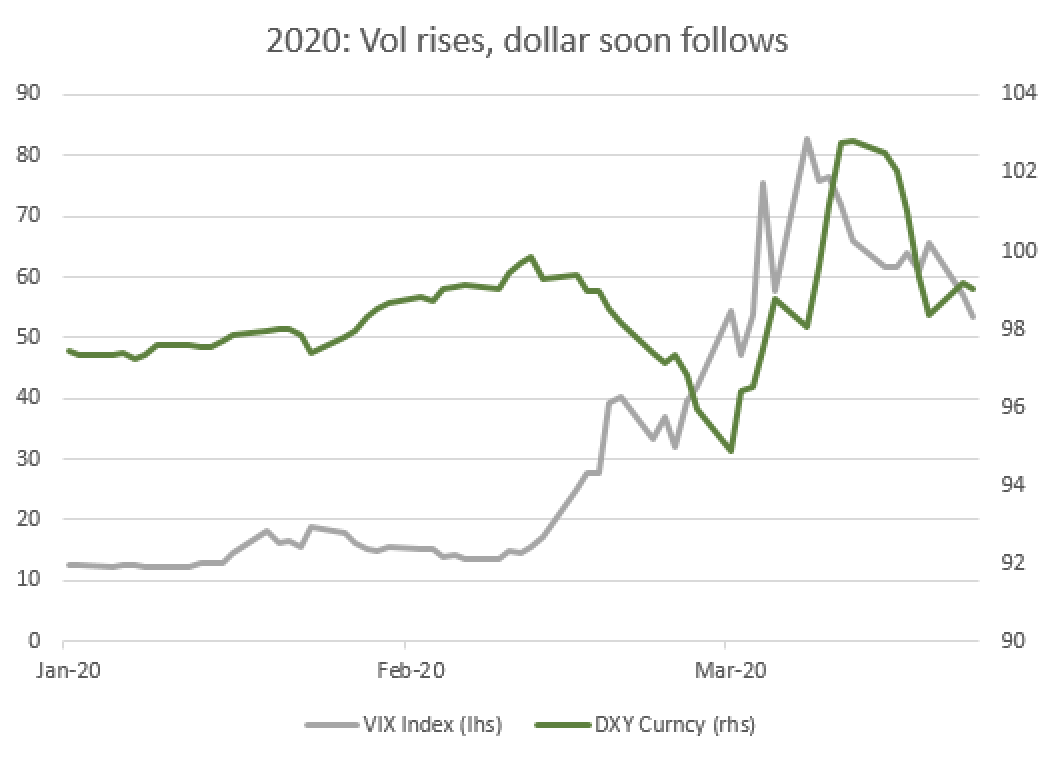
Liquidity crunches come when everyone – companies, households, governments – are trying to get their hands on dollars and no one can. Not when a momentum-centric long US dollar trade topples and takes down every other momentum-centric trade along for the ride.
“We need to distinguish between trading leverage moving markets and what is happening fundamentally in the economy and with corporate earnings,” writes Michael Purves, CEO of Tallbacken Capital Advisors.