


We’re living in the golden age of gold
Bullion has been beating US stocks by a big margin since the end of 1999.
With the S&P 500 on track to deliver back-to-back years of returns north of 25% for the first time since 1997-98, and the US making up a whopping 66% of the MSCI ACWI Index for global equities, recency bias might suggest suggest we’re living in a golden age for the US stock market.
A bit of historical perspective from Deutsche Bank, however, shows that’s anything but the case.
The asset of the new millennium has been gold, delivering a real return of 6.8% per year since the end of 1999 despite being a shiny rock that generates no earnings and pays no dividends. So far, the S&P 500 has averaged total returns of 4.9% over this stretch.
Remarkably, in a testament to how poorly-managed miners have been through boom-bust cycles, the companies that can sell gold to generate earnings and pay a dividend are actually far, far trailing the S&P 500 over this same period!
Why has the so-called barbarous relic done so well?
Well, for starters, consider that inflation-protected US Treasury yields were very low during this period. This reduces the opportunity cost of holding gold — it’s not like you were getting a substantial real return holding those instruments. We often see gold move inversely to real rates for extended periods of time.
The global financial crisis was also an event that severely undermined people’s faith in the stability of our fiat-backed system, leading to a bid for an asset that’s served as “hard money” in the past. That trend was supercharged by the broader commodity rally that followed the financial crisis thanks to Chinese stimulus that was very resource-intensive. More recently, the theme of central banks adding to their gold holdings in the wake of the sanctions that followed Russia’s invasion of Ukraine has helped buoy demand for the precious metal.
I’d add that “gold benefited from postpandemic inflation,” but that doesn’t seem to be borne out by the data. The inflation-adjusted return for gold was negative during the period in which inflation started to ramp in March 2021 through its peak in mid-2022. It was only after inflation decelerated that gold began to boom in earnest.
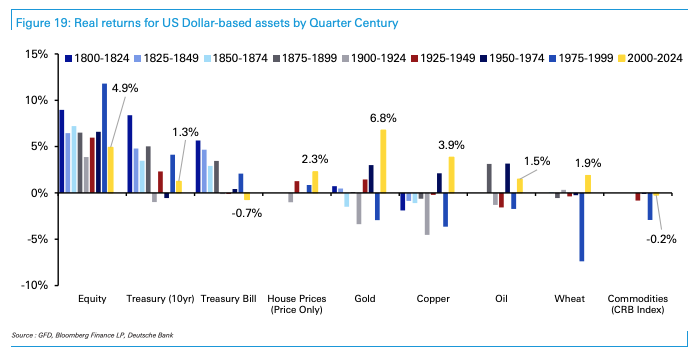
“A surprising point from this chart is that US equities haven’t actually had a great quarter century in real terms. In fact, at just +4.9% per annum, it’s the second-lowest of the nine quarter centuries since 1800,” wrote Deutsche’s team of strategists led by Jim Reid, head of global economics and thematic research. “The only worse quarter century in real terms was 1900-1924, which saw bank collapses in the early part of the period, a world war later on, and a mini depression and pandemic towards the end of it.”
The question of why this period looks so lackluster for US stocks is easier to answer: there were two large stock-market meltdowns, and the postpandemic inflation caused stocks to decline in nominal terms and produce a far worse showing in real returns during 2022.
Of course, the starting point is critical: the S&P 500’s peak during the dot-com bubble comes a few short months into the beginning of this chunk of time. Perhaps that’s extra food for thought here considering we’ve been in the midst of another mega-cap tech boom for the past decade and change — albeit one with much, much more foundational support from earnings growth than what prevailed during the dot-com boom. But in the end, we (nearly) all agree to go by the Gregorian calendar, and round numbers have prominence for a reason.
Add this to make it a veritable buffet of thought, since US stocks are very richly valued, as judged by the forward price-to-earnings ratio: “The pattern of riskier assets outperforming does normally hold over the very long run, but it can take several years for that to become evident, especially if you start from an elevated valuation point relative to history as we did in 2000,” Deutsche’s team wrote.


