
Markets
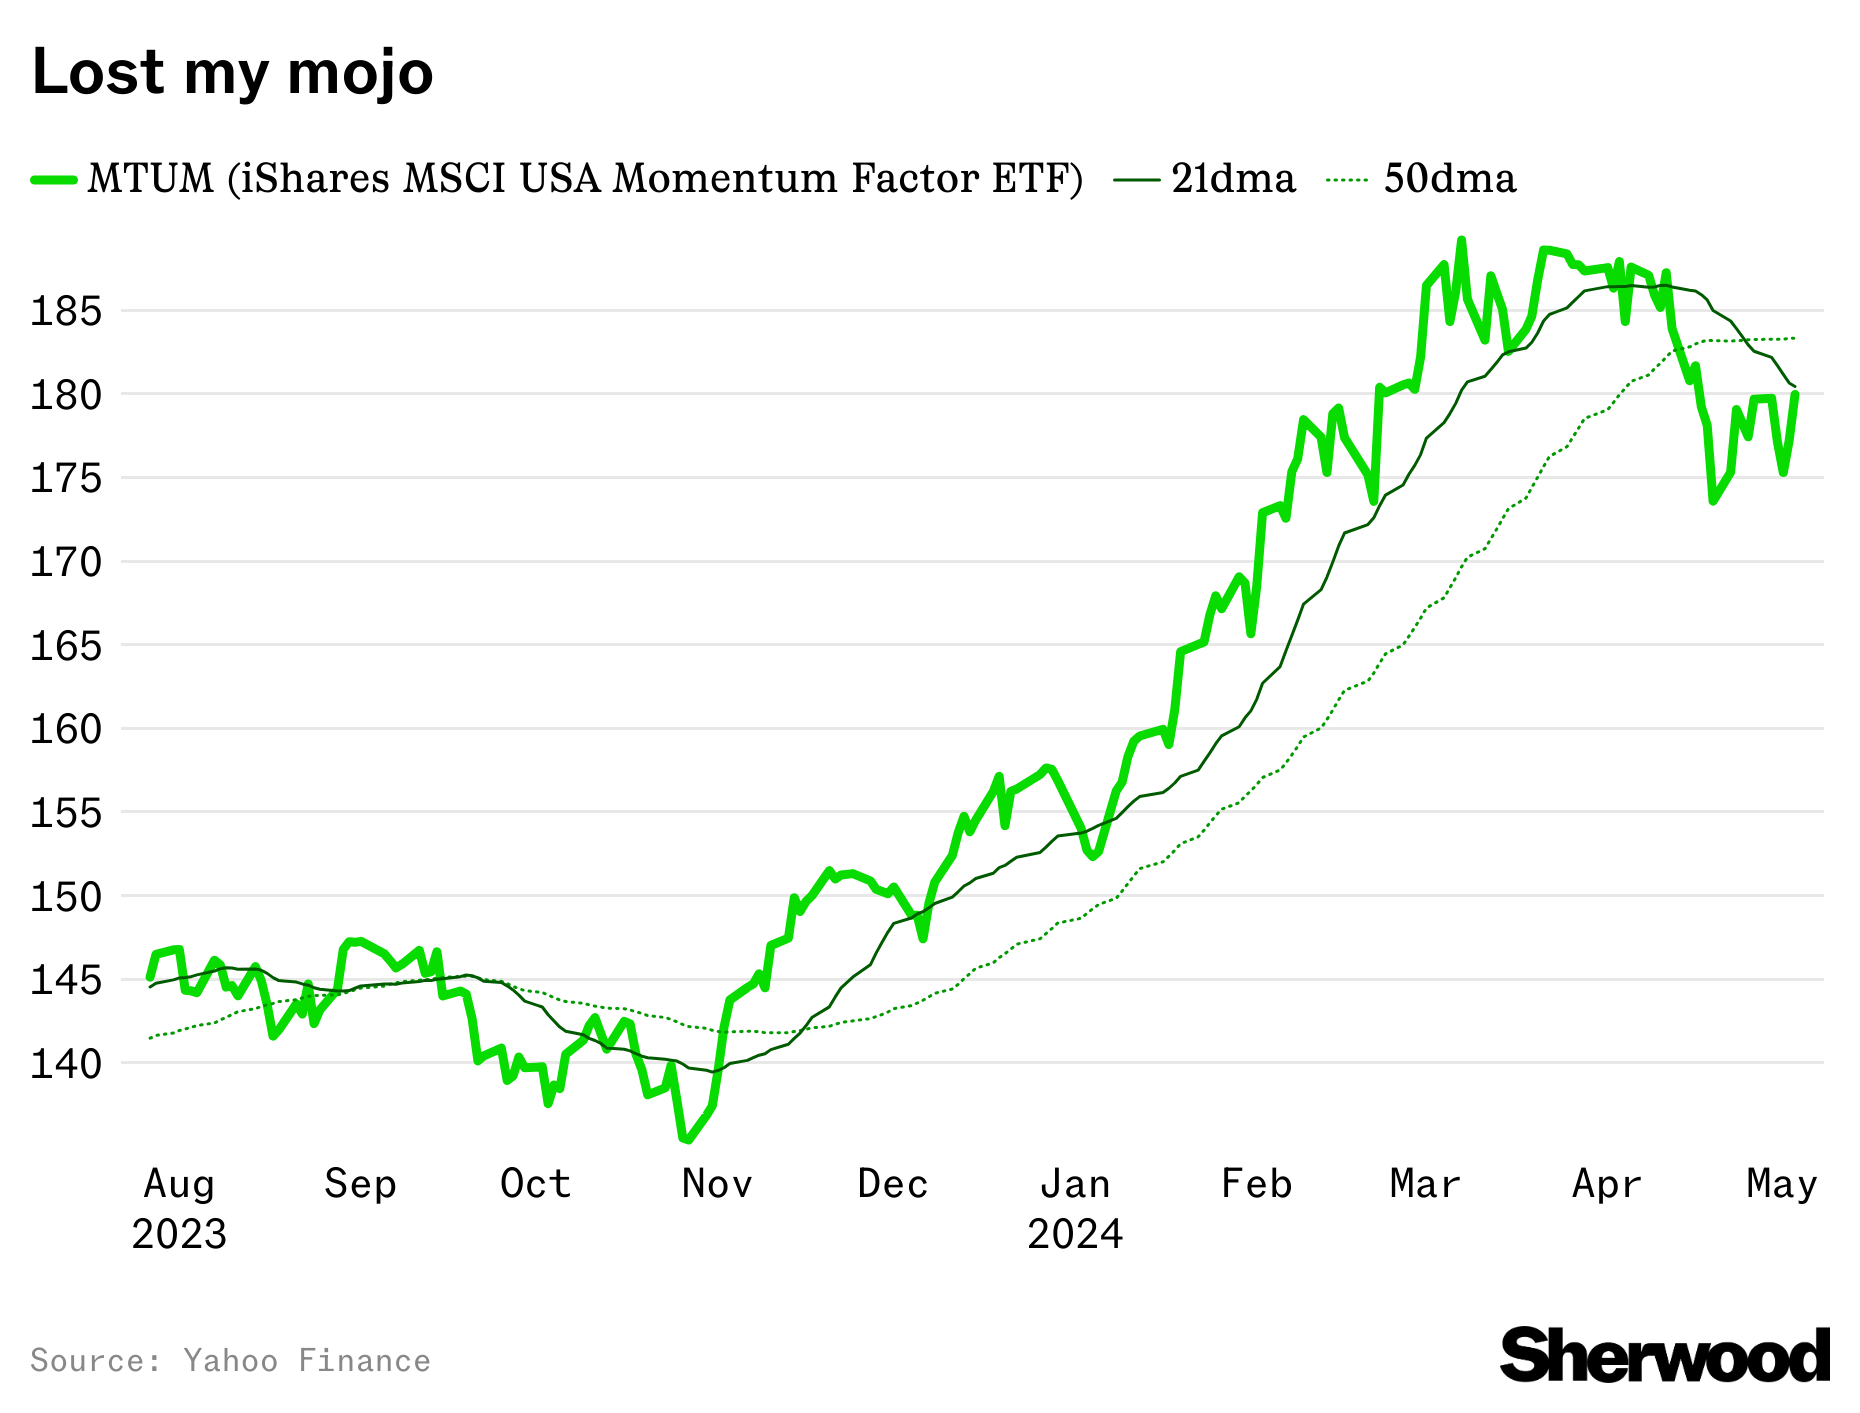
US stock momentum breakdown

US stock charts are broken. The economy isn’t.

Even after the robust 1.3% gain to end the week, the US stock market is still largely a boulevard of broken charts.

If you’re looking for a segment of the market that has:

  • A price above its 21-day moving average (21 dma), and

  • A 21 dma > 50 dma > 200 dma that have all moved higher over the past month

There’s not much there. 

This holds for the US stock market as a whole…

…and for a variety of different sectors and industry groups, from the once high-flying semiconductor space, to energy stocks buoyed by wars, to homebuilders and retailers.

That’s in stark contrast to where we stood a month ago, when the S&P 500 had closed at least 2% above its 50-day moving average for 96 consecutive sessions – the longest such stretch since 1971.

It’s a very clear and abrupt loss of momentum that’s been partially recovered, with US stocks sitting just 2.4% off record highs. The trends are far from your enemy right now, but they’re more of an acquaintance than a friend.

The good news? There’s not much evidence to suggest the pullback in US stocks had much to do with the economy or the outlook for corporate profits. So blame valuations. Or geopolitics. Or inflation. Or whatever excuse needed for profit-taking after such a historically strong run of form. (But you can’t blame the eclipse.)

Consider: Initial jobless claims remain near historic lows. Nearly 81% of people between the ages of 25 and 54 have a job as of April. There have only been 49 months (just over four years) in which a higher proportion of so-called “prime age” people were employed in US history, going back to the late 1940s.

The lion’s share of first-quarter earnings season is over, and the results have been stellar: companies are exceeding profit estimates by 8.6% so far, on average. If sustained, that would be the biggest upside surprise since Q3 2021. And 12-month forward earnings per share estimates continued to trend higher, even when the stock market wasn’t.

And there’s even one critical part of the stock market where trends stayed intact through the recent volatility: the banks.

It’s rare to have a 5% decline in US stocks where banks do better than the index at large. Over the past 10 years, banks have had a beta of about 1.25 to the S&P 500 Index (meaning their moves, in absolute terms, tend to be 25% larger than those of US stocks as a whole).

“While global economic performance was surprisingly desynchronized last year, the overall story has been consistent of late, one of economic resiliency supported by tight labor markets and the consumer,” said CEO Jane Fraser during Citi’s earnings call in April.

Simply: banks are a particularly cyclical part of the stock market, and if they’re holding up relatively well, it suggests there isn’t a host of consumer or business credit problems about to rear their heads.


More Markets

See all Markets
markets

SpaceX gets a wave of bullish ratings from Wall Street analysts

SpaceX received more than a dozen positive analyst calls on Tuesday — including from major Wall Street banks — as they initiate coverage on Elon Musk’s space and AI company.

SpaceX went public on June 12 at a $2.2 trillion valuation, the largest debut in history. While the company hasn’t yet posted a profit, it seems to have convinced Wall Street that it will get there and grow its valuation on the way.

Of the at least 17 analysts that gave a rating on Tuesday, all but one gave it a “buy” or “outperform” rating. MoffettNathanson was "neutral."

The ratings come as SpaceX joined the Nasdaq 100 index, a benchmark tech-heavy basket of companies that underpins millions of portfolios. The inclusion adds built-in demand for the stock from index funds and ETFs.

Still, SpaceX fell more than 5% on Tuesday amid a broader sell-off, and is currently effectively flat from its opening price of $150 a share.

markets

Nike sinks to lowest level since 2014 after warning of “challenged” sales environment in Q4 report

Did Nike do it?

Investors had a mixed reaction after the global sports apparel company reported its fourth quarter earnings on Tuesday after the bell. Shares initially rose 5% as Nike beat out Wall Street expectations amid a hefty tariff refund bonus. However, the stock then sank to its lowest level since August 2014 in postmarket trading.

Here are the Q4 numbers:

  • Revenue of $11.0 billion (estimate: $10.8 billion).

  • Adjusted earnings per share of $0.20 (estimate: $0.12).

Ahead of this report, Nike warned that results would be flattered by a one-time tariff refund (now estimated at roughly $0.52 per share for the bottom line). That gave the company an extra cushion in snapping its streak of seven quarters of year-over-year profit declines.

Over the past year, the company had been punished by tariffs on imported goods, stagnant consumer spending, and increasing competition from other footwear brands like New Balance, Adidas, and Hoka.

Outgoing CFO Matthew Friend deemed it an “increasingly challenging operating environment, where sell-through remains challenged.”

Latest Stories

Sherwood Media, LLC and Chartr Limited produce fresh and unique perspectives on topical financial news and are fully owned subsidiaries of Robinhood Markets, Inc., and any views expressed here do not necessarily reflect the views of any other Robinhood affiliate, including Robinhood Markets, Inc., Robinhood Financial LLC, Robinhood Securities, LLC, Robinhood Crypto, LLC, Robinhood Money, LLC, Robinhood U.K. Ltd, Robinhood Derivatives, LLC, Robinhood Gold, LLC, Robinhood Asset Management, LLC, Robinhood Credit, Inc., Robinhood Ventures DE, LLC and, where applicable, its managed investment vehicles.