


Go Deeper with Market Depth
Nasdaq TotalView powers the need-to-know data serious investors rely on.
When it comes to trading, information is the most valuable form of currency. Historically, a deep understanding of crucial data has given institutional investors an edge.
But many retail investors aren’t aware that the tools used by pros are also available to them. Enter depth of book data: a complete, comprehensive picture of real-time orders at every price level. This allows you to see the prices at which other traders are willing to buy or sell a security. By understanding the supply and demand of a security at different price levels, you can make more informed investment decisions just like the pros.
Basics of Market Data
When it comes to the pricing info of a security, there are different levels of market data information available: Last Sale, Level I, and Level II. Last Sale is the most recent price a security was traded at.
Beyond that is Level I, or top of the order book. Level I contains Last Sale data, in addition to the best bid (the highest price a buyer is willing to pay) and the best ask (the lowest price a seller is willing to accept).
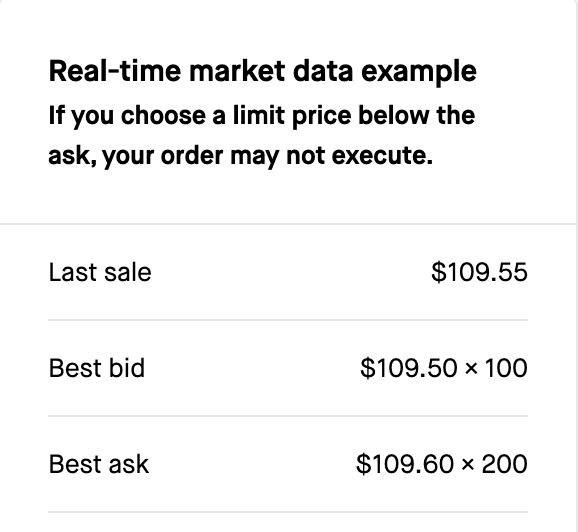
Level I is more useful pricing than just the last sale because you can’t necessarily trade a security at its last sale price. That's because the last sale reflects what a previous seller wanted to sell for, but not necessarily the price the remaining sellers are interested in. If you want to immediately buy a security, you can pay the ask (or accept the bid, if you’re a seller). Like the last sale price, the bid and ask will be constantly changing, especially for high volume securities.
What Is Level II?
Serious traders, however, want to see supply and demand across all price levels, not just the current bid and ask. Building on Level I, Level II data shows you the depth of the order book, meaning you can see the quantity of open orders for many price levels. It’s worth noting that the term “Level II” is a general term referring to multiple levels of market data that is often interchanged with other terms such as depth of book data or order book depth. The term is also sometimes applied to full depth of book products such as Nasdaq TotalView due to Level II being a commonly recognized term for depth.
Level II also allows traders to analyze volume: when looking at the order book, it’s important to note the order size at each price level. By analyzing the order book, you can get a better sense of whether your order is likely to get filled at a certain price.
One thing to be aware of is that the order book changes quickly. Because it incorporates open limit orders, it is constantly changing as traders’ orders are filled or canceled.
Trading Smarter with Market Depth
Analyzing Level II data can provide valuable insights that aren’t available in Level I. Crucially, it can help traders identify areas of liquidity, which is how easily a security can be bought or sold. In general, securities with greater liquidity are less susceptible to volatility than illiquid securities, because there is a greater volume of potential buyers and sellers, and prices won’t be disproportionately impacted by a single large order. Securities with good depth have a good level of volume on both the buy and sell sides.
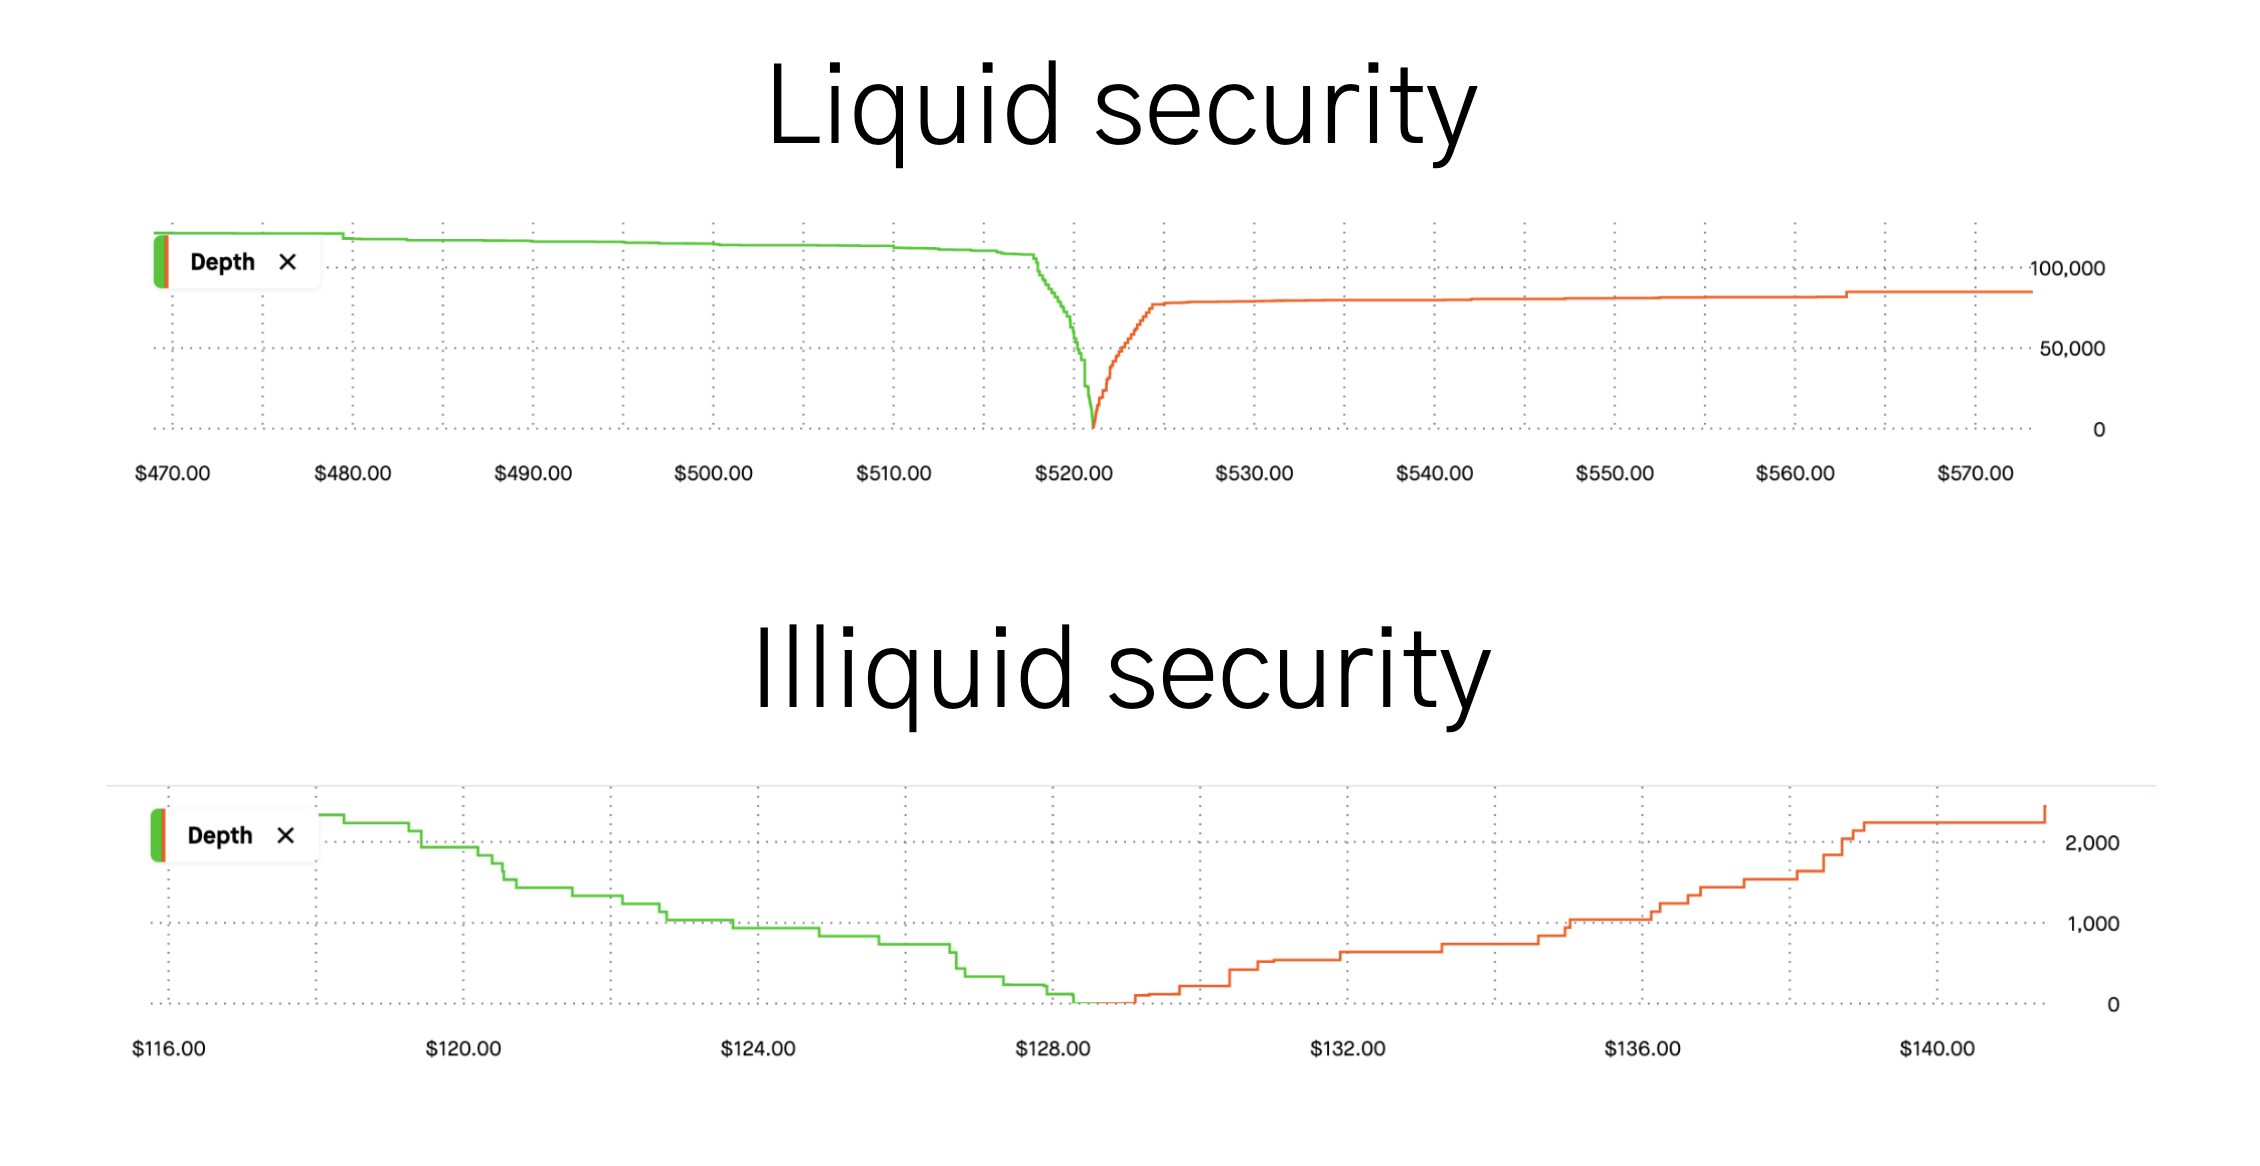
For traders who are placing large orders, liquidity is especially important, because you can get a sense of whether there will be sufficient supply to fill your entire order at a certain price. Even if you’re not placing significantly large orders, noticing unusually high-volume orders at a particular price can offer average investors insight into what the big institutional players are doing.
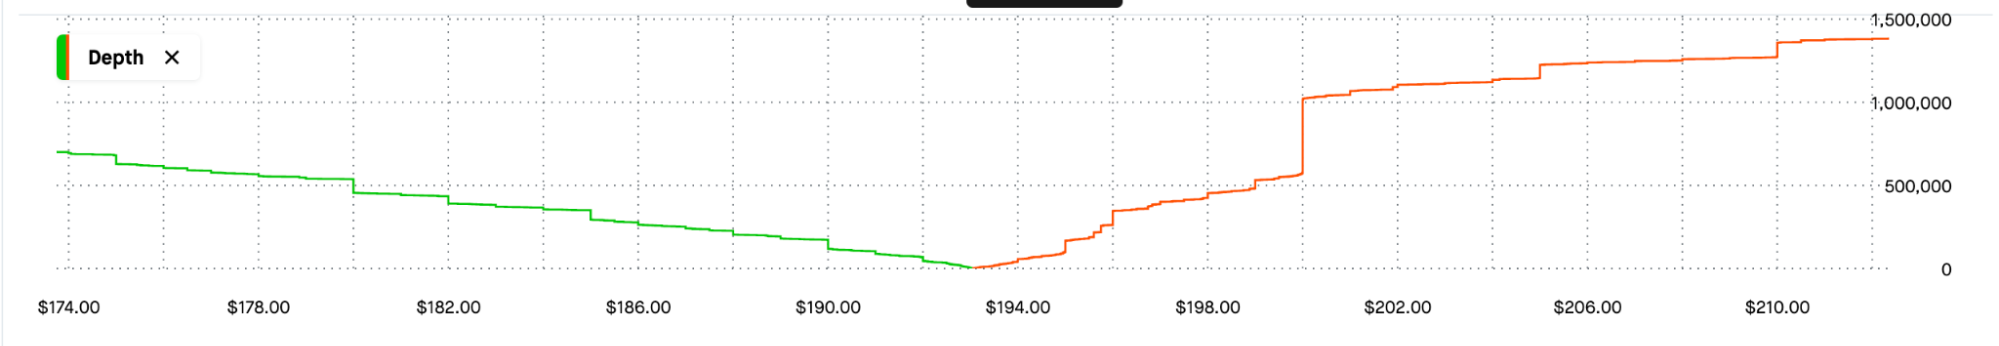
Depth Chart
The depth chart is a visualization of the order book and can help traders identify areas of support (price floors), and resistance (price ceilings). For example, a steep wall on the sell side could indicate an area of resistance, since a large number of orders will have to be filled before the security’s price can go lower. On the other hand, a wall on the buy side could indicate an area of support. In the example below, $200 is a resistance level, because many orders will need to be filled before the price can move above $200.
To increase the likelihood of a fill, traders may strategically place orders just above support or just below resistance.
Leveling Up with Level II
Consulting the order book is an important step for most professional traders. With advances in retail brokerage platform capabilities and access to more market data, individual retail traders who want to trade like the pros are increasingly leveraging market depth to empower their trading decisions. As retail traders become more sophisticated, analysis from full depth of book provides insight into where liquidity is moving and how the market supply and demand might impact a trading strategy. For retail traders who are looking for an edge, Level II can help you understand not just where a security’s price is but also where it’s going.
Nasdaq TotalView powers the Level II data offered by many brokerages, including Robinhood Financial, which offers Level II data to Gold customers. Learn more about Nasdaq TotalView. You can also experiment with depth data using Nasdaq BookViewer before subscribing within your brokerage platform.