Bitcoin flashes warning sign that “bear market remains”
“The 200-day MA has consistently acted as the boundary between relief rally territory and trend resumption.”
Bitcoin has hit resistance at the 200-day moving average (MA) near $82,400, following a 37% price rally from its April low, a “key bear market ceiling,” CryptoQuant analysts wrote in a report.
In a potentially troubling sign for Bitcoin, Julio Moreno, CryptoQuant’s head of research, said the current pattern is reminiscent of the March 2022 bear episode, when bitcoin rallied 43% before hitting the 200-day MA and resuming its downward trend.

“In bear markets, the 200-day MA has consistently acted as the boundary between relief rally territory and trend resumption: A failure to break above the 200-day MA — as occurred now and in March 2022 — is historically the strongest technical confirmation that the bear market remains structurally intact,” Moreno said.
The CryptoQuant Bull Score Index has fallen to 20 from 40, as bitcoin sentiment shifts to extremely bearish.
“Historically, readings in the 0–20 range have either preceded further price declines or an extended period of sideways compression,” Moreno wrote in the report.

Several experts said that while bitcoin trading back below the 200-day MA invites comparisons to March 2022, it’s not quite the same setup.
Nicolai Søndergaard, a research analyst at Nansen, told Sherwood News that in 2022, the market was heading into a more fragile de-leveraging phase, whereas today’s positioning still looks less stretched. In addition, bitcoin perpetual open interest is around $2.2 billion, he said, which does not yet suggest the kind of excess that typically precedes a full bear market unwind.
Jimmy Xue, cofounder and COO of Axis, told Sherwood that while the March 2022 comparison is useful as a warning, as bitcoin failing near the 200-day MA shows the market has not yet demonstrated a durable trend reversal, it’s not a one-for-one match, as bitcoin has a larger institutional channel, especially through spot ETFs, and a more mature liquidity base.
Adam Haeems, head of asset management at Tesseract Group, told Sherwood that while the 200-day rejection is a meaningful technical level, it’s not the catalyst this market is trading around.
Instead, Haeems said he is watching the consistent weakening on the demand side, as bitcoin ETFs have shed roughly $2 billion in net outflows over the past two weeks and the Coinbase Premium Index has stayed negative through both the rally and the pullback.
“What resolves it for us is whether ETF flows turn net positive over the next five sessions and whether $70,000 holds on first test,” Haeems said.
CryptoQuant’s Moreno also noted that the $70,000 level, the Traders’ On-chain Realized Price (a break-even point for traders), is the primary on-chain support target.
“The Traders’ Realized Price has functioned as a precise inflection point throughout the current bear market cycle. It acted as resistance in January 2026, where bitcoin was rejected at the same level during a rally,” he said.
Finally, Glassnode analysts said that a sign of a credible bull market transition would be not only reclaiming the True Market Mean at $78,300, but also weeks to months of sustained consolidation around this level, as prior cycles’ pre-bull market phases have shown.
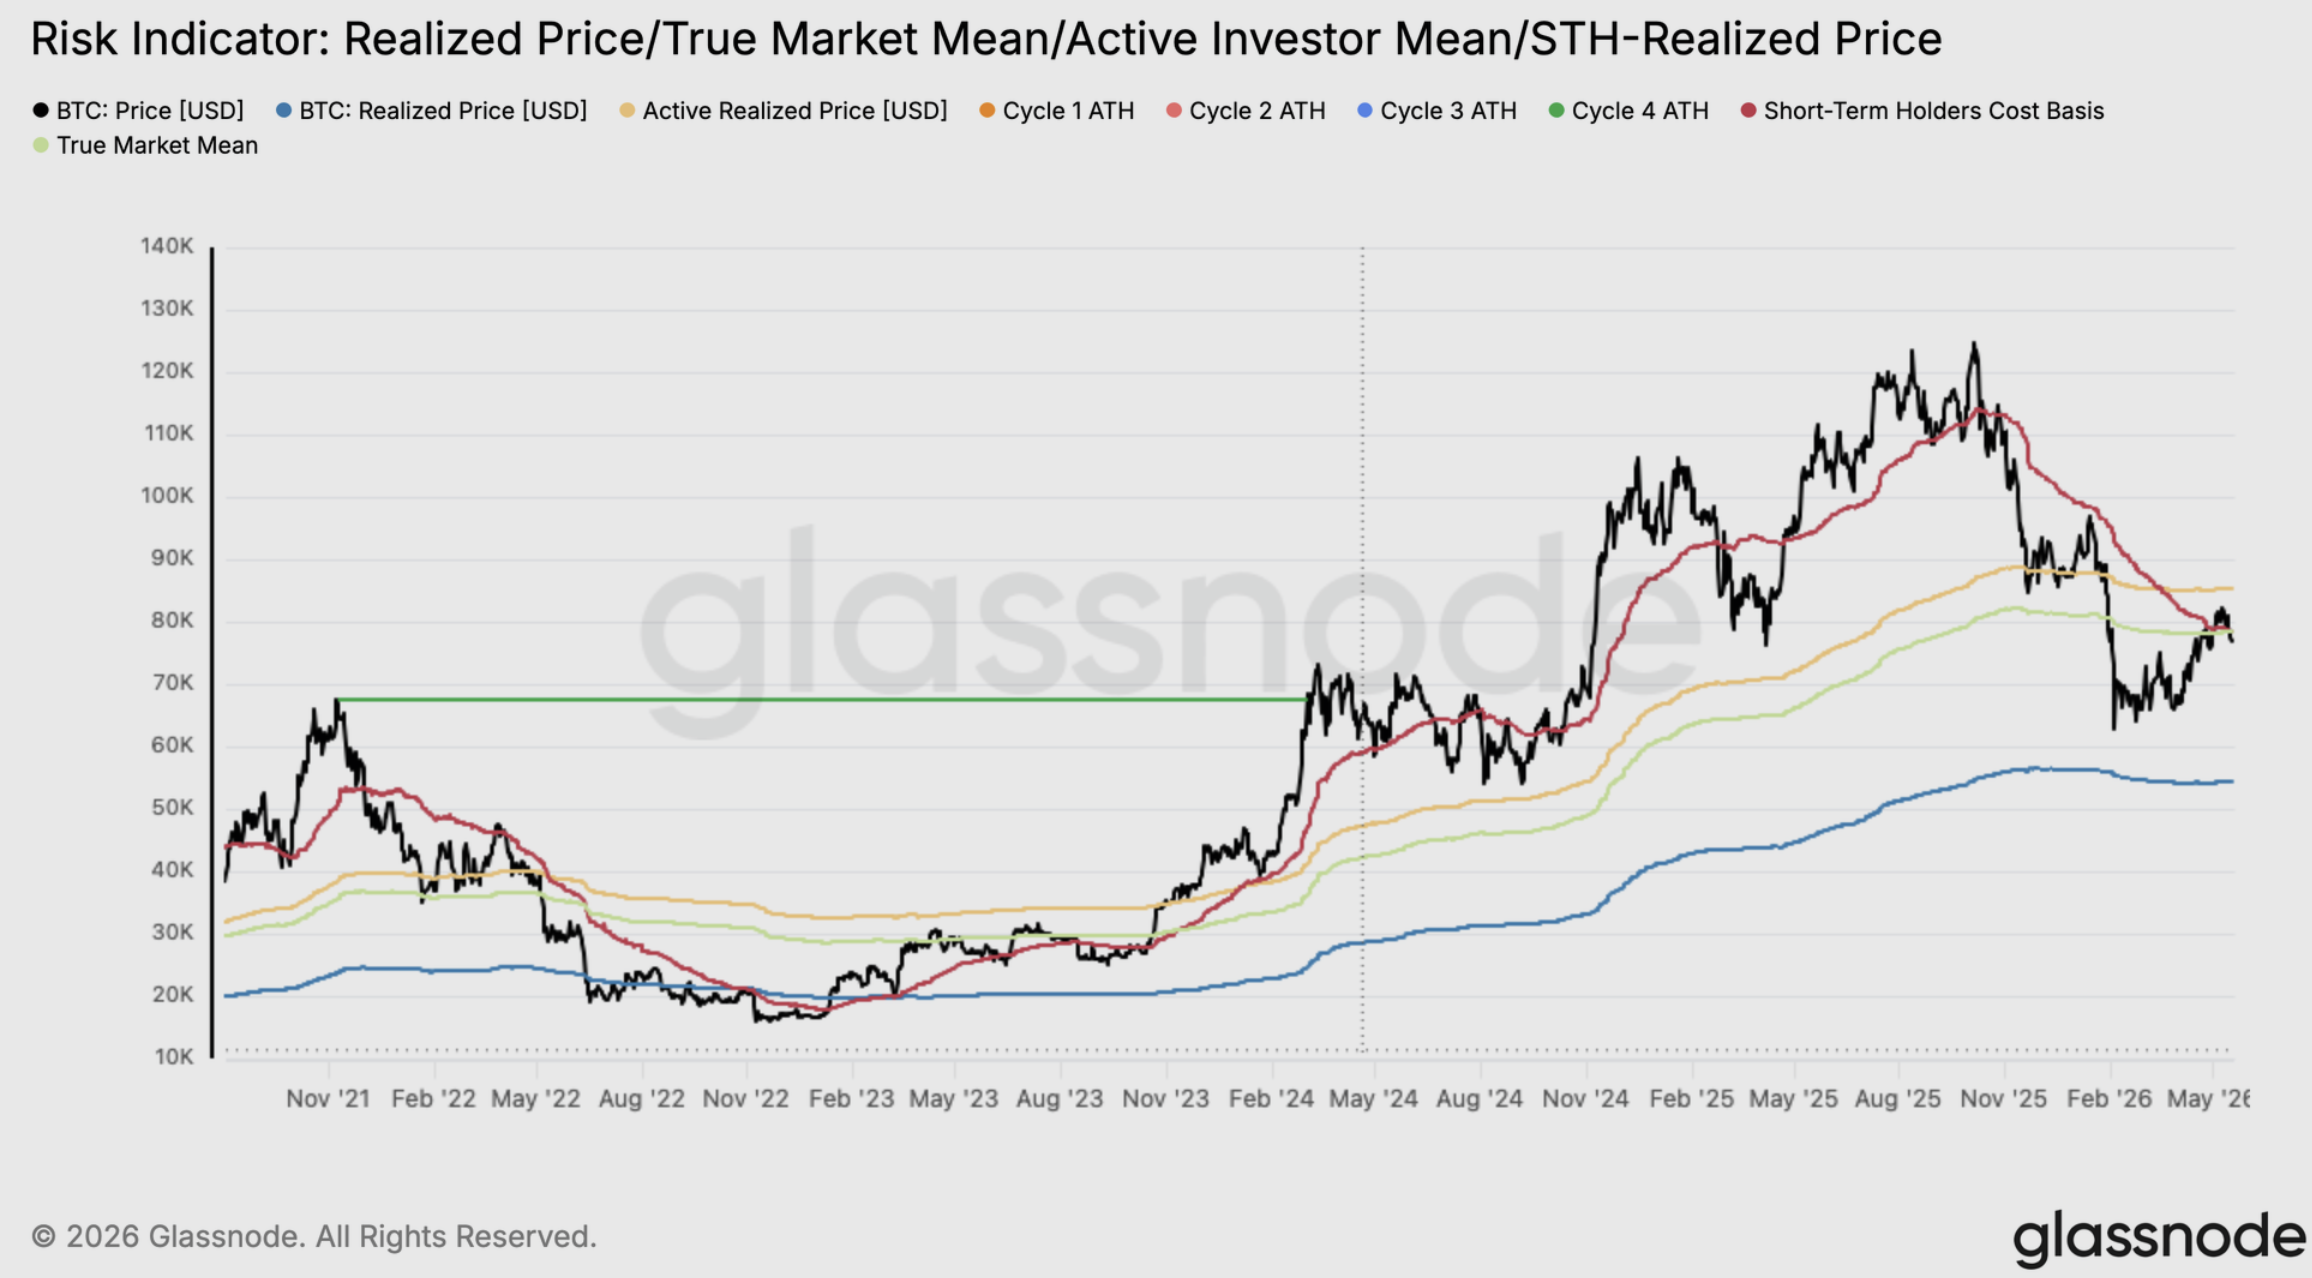
“A single decisive move above the True Market Mean, while constructive, does not yet satisfy this requirement,” they said.