
Markets
Screaming Man
Screaming man

The three technical charts raising jitters over the AI trade

Semis head and shoulders, Nvidia below the 50-day average, and September seasonality.

Luke Kawa

A soft start to September after a poor end to August has left the most important part of the stock market — everything related to AI — in a shakier state.

A Morgan Stanley basket of AI tech beneficiaries fell 5.5% over the past two sessions, its worst two-day drubbing since the sessions immediately following “Liberation Day” on April 2, when the extent of President Donald Trump’s reciprocal tariff regime was unveiled.

With Google and Apple roaring on Wednesday, the picture is a little brighter for the AI trade. But in the background, there are still three technical spots of bother with the complex that’s been critical to the US stock market’s gains for the past two years and counting.

Semiconductors are in a precarious position, with the VanEck Semiconductor ETF not too far away from completing a bearish head-and-shoulders top pattern recently flagged by Bank of America head of technical research Paul Ciana.
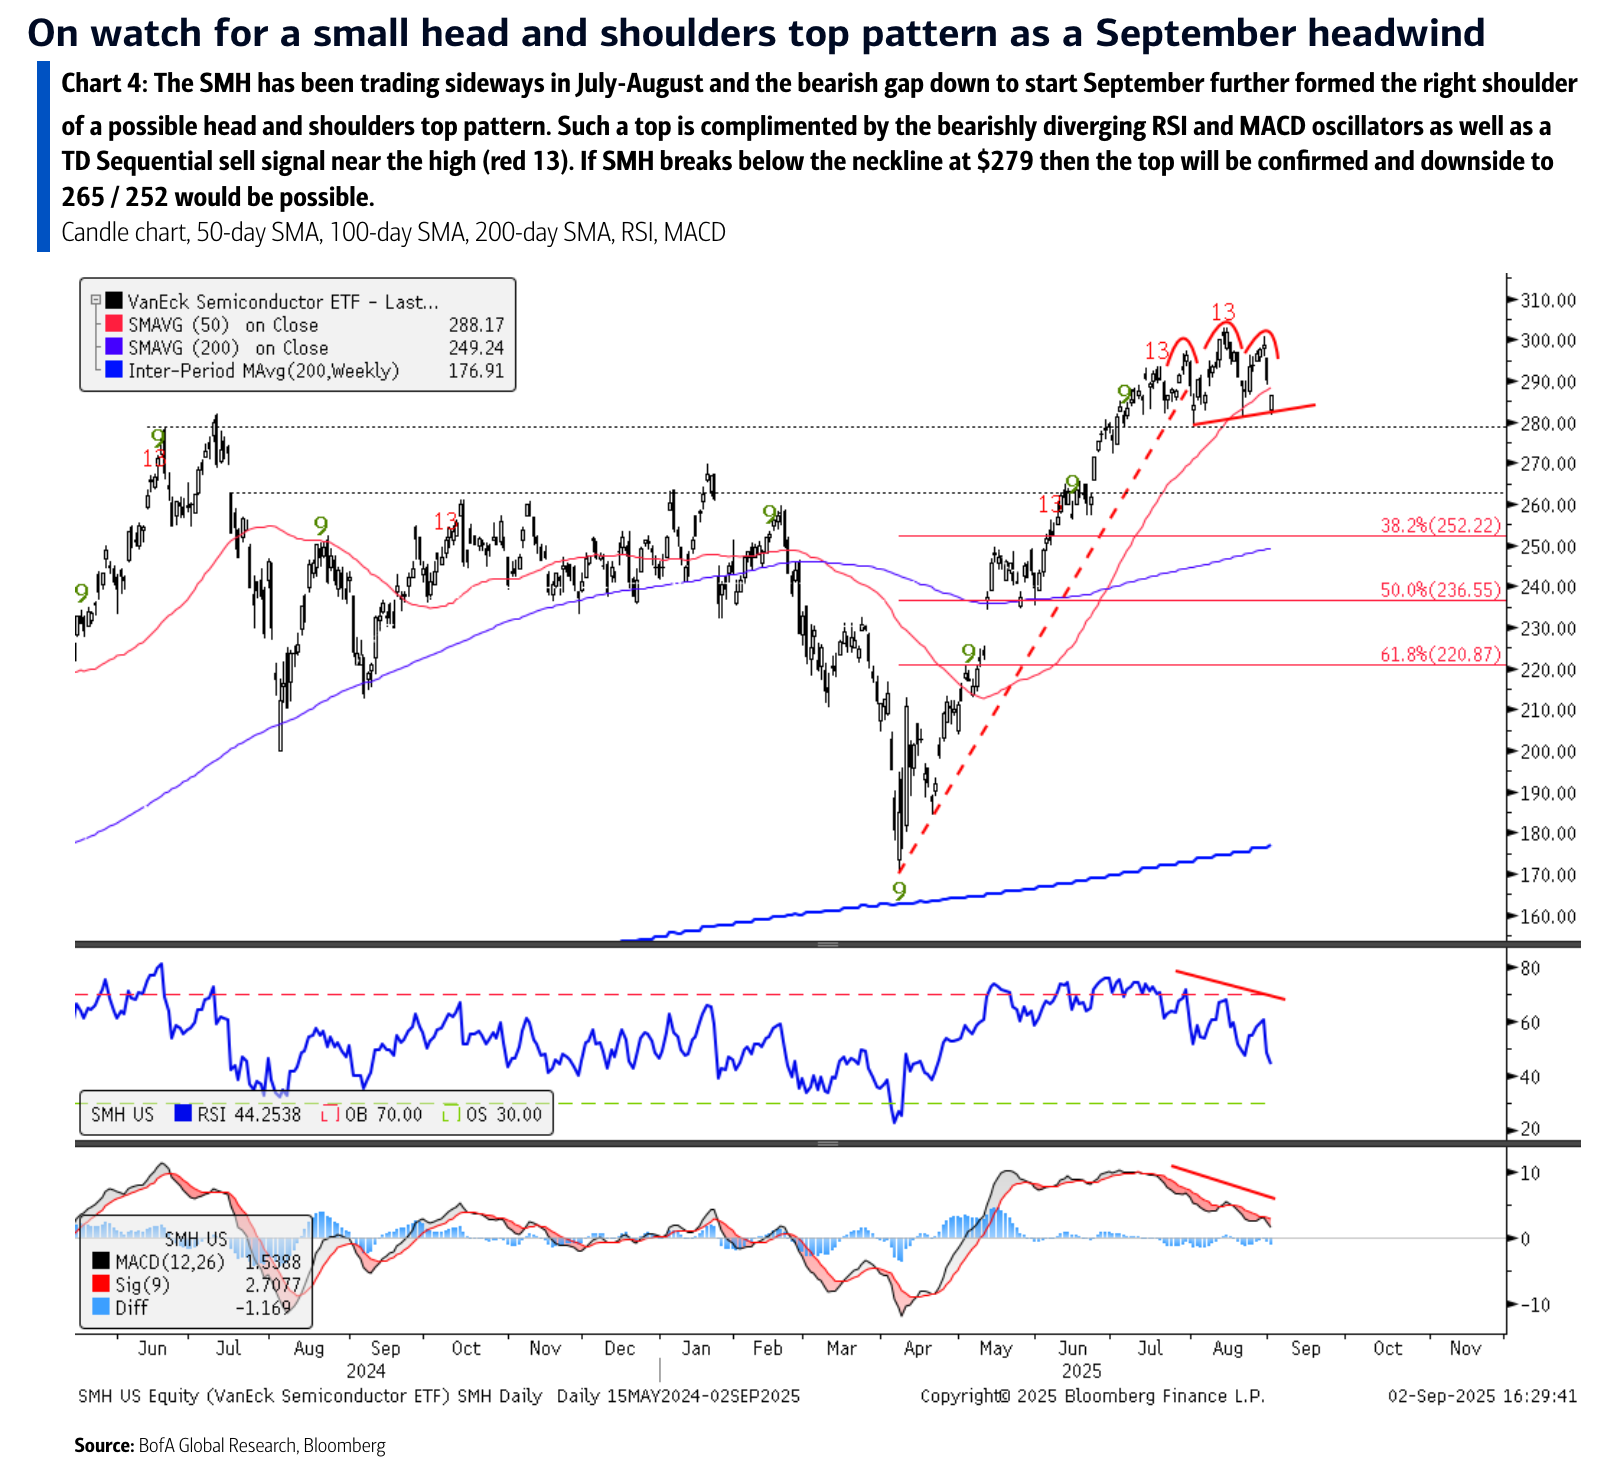
BofA SMH H&S

Zooming in on the most important semiconductor stock: Nvidia, the heart, soul, and many other body parts of the AI trade, closed below its 50-day moving average on Tuesday for the first time since May, when it was repairing damage done in the wake of the momentum meltdown and tariff angst that roiled markets.

Since the AI boom unofficially kicked off in May 2023, there have been only four previous instances where Nvidia had a fresh break below its 50-day moving average (that is, closing below that level for the first time in at least 21 sessions):

  • August 9, 2023

  • April 19, 2024

  • July 24, 2024

  • December 10, 2024

And now, yesterday. The good news is that breaching that technical threshold hasn’t been a big deal for Nvidia. One-month forward returns from the above dates have been strongly positive (up at least 7%) on three of four occasions, and the one loss was less than 2%.

But oh yeah, it’s September, a seasonally bad time for the stock market. Returns have varied widely for the Nasdaq 100 over the past 20 years, from up as much as 13% to down nearly 15%, but on average it’s been the only month with negative returns for the tech-heavy gauge.

“One needs to be pragmatic while at these levels, namely because the tape is not only following the Fed Cut script closely of buying the rumor to then sell the news, but also because divergences in momentum and breadth as well elevated levels of complacency, all of which leaves the market open to a violent, yet buyable dip opportunity,” wrote John Kolovos, chief technical market strategist at Macro Risk Advisors.

That being said, he’s still constructive on the medium-term technical picture for stocks through year-end and early into 2026.

More Markets

See all Markets
markets

SpaceX gets a wave of bullish ratings from Wall Street analysts

SpaceX received more than a dozen positive analyst calls on Tuesday — including from major Wall Street banks — as they initiate coverage on Elon Musk’s space and AI company.

SpaceX went public on June 12 at a $2.2 trillion valuation, the largest debut in history. While the company hasn’t yet posted a profit, it seems to have convinced Wall Street that it will get there and grow its valuation on the way.

Of the at least 17 analysts that gave a rating on Tuesday, all but one gave it a “buy” or “outperform” rating. MoffettNathanson was "neutral."

The ratings come as SpaceX joined the Nasdaq 100 index, a benchmark tech-heavy basket of companies that underpins millions of portfolios. The inclusion adds built-in demand for the stock from index funds and ETFs.

Still, SpaceX fell more than 5% on Tuesday amid a broader sell-off, and is currently effectively flat from its opening price of $150 a share.

markets

Nike sinks to lowest level since 2014 after warning of “challenged” sales environment in Q4 report

Did Nike do it?

Investors had a mixed reaction after the global sports apparel company reported its fourth quarter earnings on Tuesday after the bell. Shares initially rose 5% as Nike beat out Wall Street expectations amid a hefty tariff refund bonus. However, the stock then sank to its lowest level since August 2014 in postmarket trading.

Here are the Q4 numbers:

  • Revenue of $11.0 billion (estimate: $10.8 billion).

  • Adjusted earnings per share of $0.20 (estimate: $0.12).

Ahead of this report, Nike warned that results would be flattered by a one-time tariff refund (now estimated at roughly $0.52 per share for the bottom line). That gave the company an extra cushion in snapping its streak of seven quarters of year-over-year profit declines.

Over the past year, the company had been punished by tariffs on imported goods, stagnant consumer spending, and increasing competition from other footwear brands like New Balance, Adidas, and Hoka.

Outgoing CFO Matthew Friend deemed it an “increasingly challenging operating environment, where sell-through remains challenged.”

Latest Stories

Sherwood Media, LLC and Chartr Limited produce fresh and unique perspectives on topical financial news and are fully owned subsidiaries of Robinhood Markets, Inc., and any views expressed here do not necessarily reflect the views of any other Robinhood affiliate, including Robinhood Markets, Inc., Robinhood Financial LLC, Robinhood Securities, LLC, Robinhood Crypto, LLC, Robinhood Money, LLC, Robinhood U.K. Ltd, Robinhood Derivatives, LLC, Robinhood Gold, LLC, Robinhood Asset Management, LLC, Robinhood Credit, Inc., Robinhood Ventures DE, LLC and, where applicable, its managed investment vehicles.