


The American Dream is getting really expensive
Homeownership increasingly requires a $100k+ annual income
Curbed appeal
As wage growth struggles to keep pace with home price inflation, buying a house has felt increasingly out of reach for millions of Americans recently — a trend that’s been ongoing for the last 3+ decades.
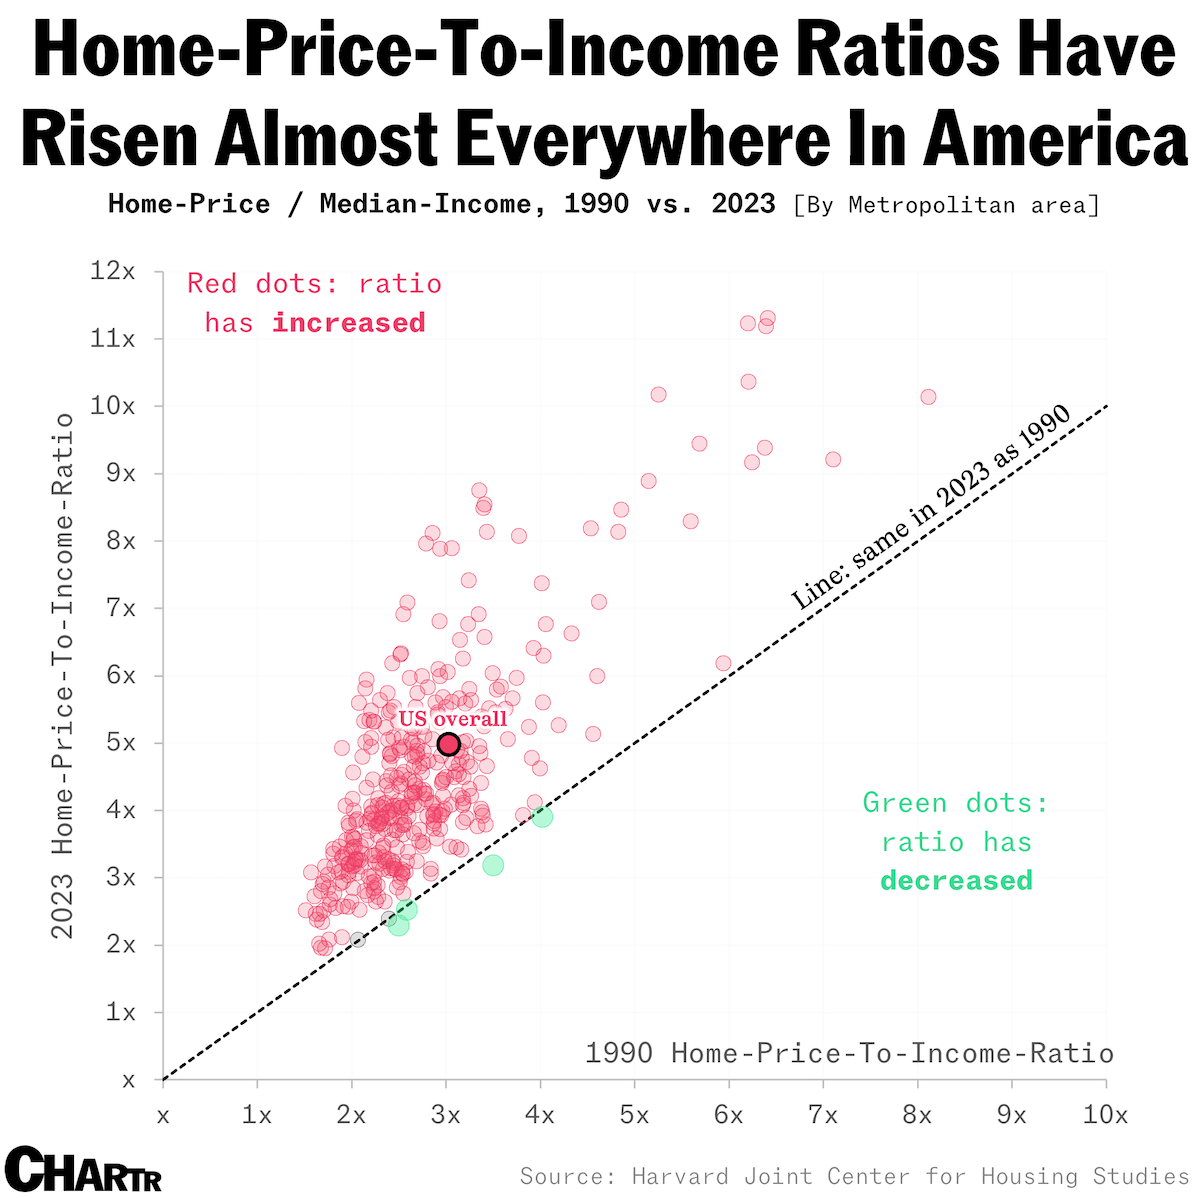
Indeed, in 2023, a typical home in America will cost buyers 4.9x the median income. That’s a 50%+ increase on the 3.1x price-to-income ratio averaged in 1990 and only slightly below the record figure set in 2022, according to new analysis from the Harvard Joint Center for Housing Studies.
Furthermore, this is a phenomenon that’s happening almost everywhere: a whopping 378 out of the 384 American Metropolitan areas (98.4%) that Chartr analyzed from the Harvard report saw rises between 1990 and 2023. Just 2 areas reported a home-price-to-median-income ratio that was the same as in 1990 and only 4 reported a drop.
Inflation continues to be the factor in how Americans perceive the economy — and the cost of houses is a major factor in that sentiment. Across the US, home prices have surged by 47% since the start of 2020 and have more than doubled since 2010, based on data from the NAR cited in the report.
While new-home construction has fallen to a 4-year low, there’s also fewer existing homes entering the market. Rising interest rates have created a "golden handcuff" effect, discouraging homeowners from selling and taking on new, more expensive mortgages. Additionally, more homes are owned by older generations who are less likely to move. This has all culminated in a stark reality: you now need an annual income of $100,000 to afford a median-priced home in nearly half of all metro areas.
As for renters? The majority of them are already declaring the American Dream of homeownership dead.


