

This chart shows how Donald Trump is the king of stock market volatility
Well, here is an absolute banger of a chart from Fundstrat that is sure to simultaneously please and annoy everyone:
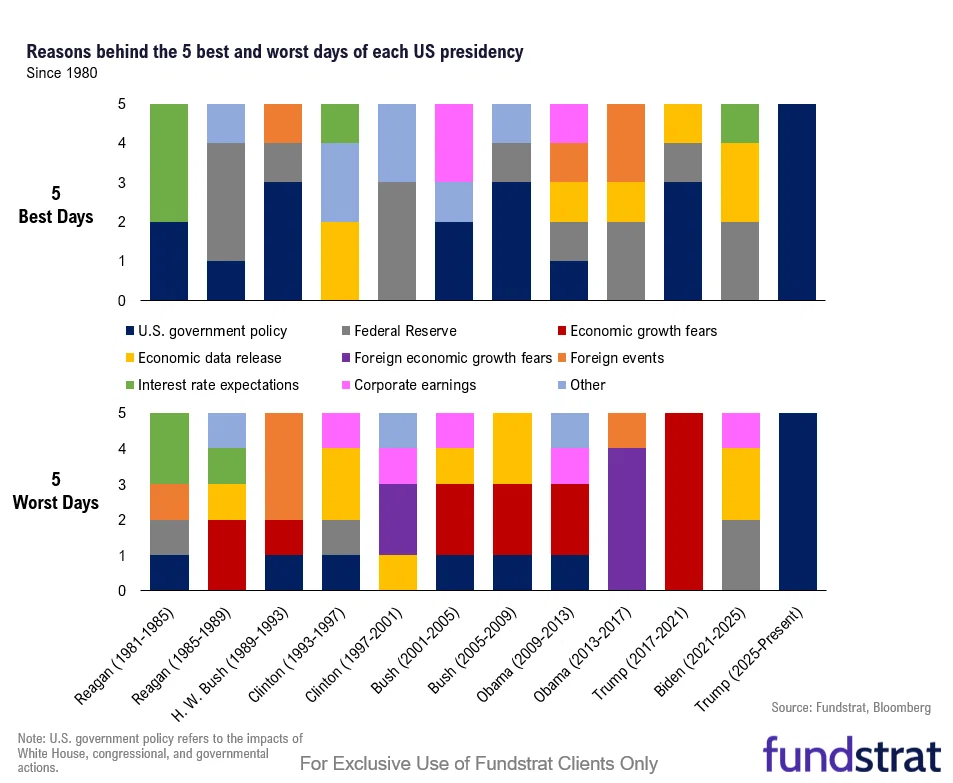
Macro data scientist Alex Wang’s chart on the causes of the five best and worst market days during different presidencies demonstrates how much the Oval Office has driven US stock market volatility during President Trump’s second term in office.
My very loose, abstract description of what policymakers do is “try to make things better.” (As for what constitutes “things” and “better,” well, tens of millions of Americans will have to agree to disagree.)
Most of the time, these things the president and Congress pursue are not a massive shock to the financial system, though there’s always a doomsayer warning that something like Obamacare will spell the end for US stocks. And that means most of the time, you can probably expect a positive skew: policymakers will be coming in with stimulus to support the economy and markets in the face of unexpected downside.
Per Fundstrat’s analysis, that clearly hasn’t been the case in the past 15 months. You can look at this one of two ways. Perhaps this period has been a time of such economic stability and impressive earnings growth that some of those other catalysts for massive one-day drops haven’t materialized. We’re blessed to have gotten to enjoy such a solid backdrop! Or you could suggest this is indicative of a fundamentally more activist presidency and more frequent policy decisions that carry higher macroeconomic consequences compared to previous presidencies. We’re doomed to swing wildly based on what we see next on Truth Social!
There have been a lot of wonderful studies released by asset managers on the importance of not missing the 10 best days in the market in any given year. (It’s less often mentioned by folks who have a vested interest in you investing your money about how much better returns would be if you miss the 10 worst days of the year!) The problem is that these sessions are typically clustered so close together that it’s an impossible task to navigate twisted, volatile waters so cleanly.
The upshot: Trump-induced volatility has been noise, with the biggest five losses nearly perfectly canceling out the biggest gains. There’s an underlying non-Trump, mainly AI trend that’s mattered, and that’s probably the main reason the US stock market is where it is.


