


Record speed-run into small caps leaves US stock market searching for catalysts
Will the sparks that ignited the small-cap surge have staying power?
We finally have a new theme to talk about in the stock market. Exuberance over all things artificial intelligence – at the expense of everything else – has given way to a bit of AI ennui. Gone are the days of narrow markets and low breadth. Now, smaller publicly-traded companies finally found enough excuses to power higher in one of their strongest stretches on record.
The Russell 2000 Index of US small-cap companies has gained 11.5% over the last five sessions. It’s outperforming the S&P 500 by almost 10% over this span, the most on record.
History was made today.
— Bespoke (@bespokeinvest) July 16, 2024
The Russell 2000 closed 4.4 standard deviations above its 50-day moving average.
No other major US index (Dow since 1900, S&P 500 since 1928, and Nasdaq since 1971) has ever closed at that much of an extreme.
"Where were you when..." pic.twitter.com/gd67vSKZx1
Narrative flip
A performance shift this decisive demands a narrative to explain why it all makes sense. A softer-than-anticipated US CPI inflation report fortified expectations for the Federal Reserve to begin cutting rates by September. And the failed attempt on former President Donald Trump’s life has increased the market-implied probability of his victory in November’s presidential race, as well as the electoral success of the Republican Party more broadly.
Small caps do sit at the center of this important Venn diagram:
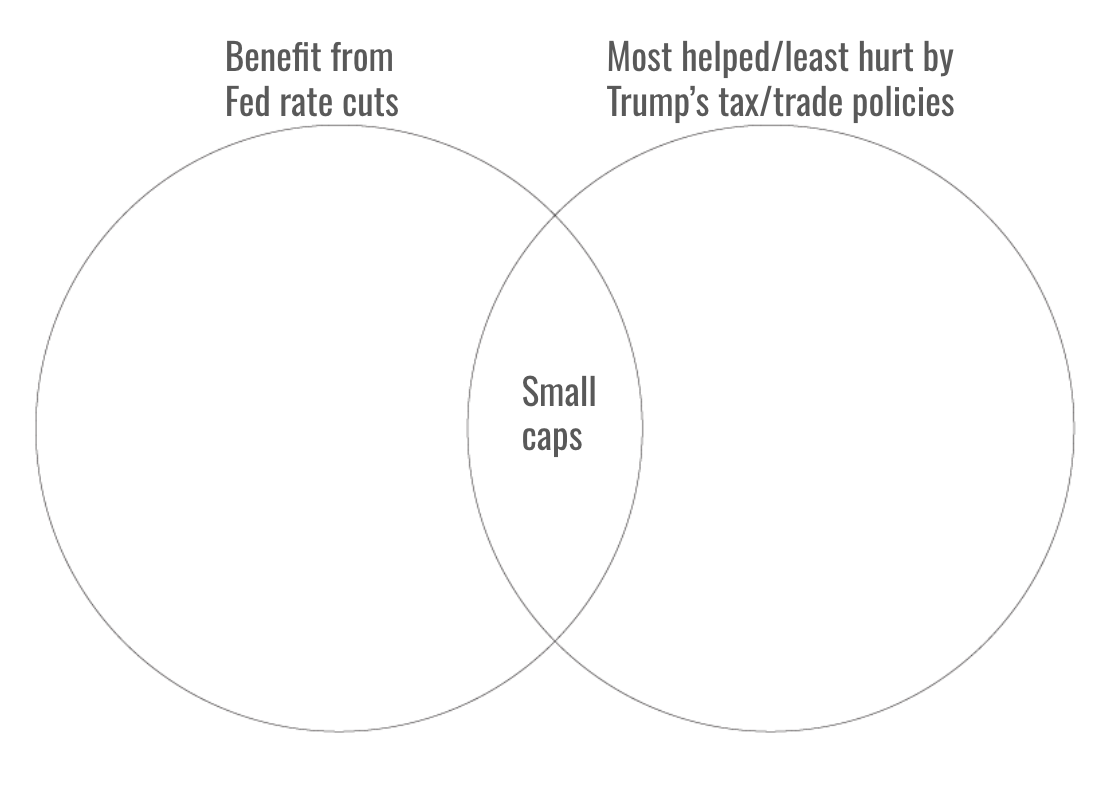
Smaller companies are more leveraged than larger ones. The net debt to EBITDA ratio for the S&P 500 was about 1.4 in 2023, versus more than 4 for either the Russell 2000 or S&P 600 small-cap indexes. And smaller companies’ debt is more likely to be floating rate than termed out, so lower policy rates provide a near-immediate financial benefit.
Small caps are also more domestically-oriented. As such, they tend to face higher tax rates than their larger peers, and therefore stand to gain more from the extension of the 2017 Tax Cuts and Jobs Act. A basket of US stocks curated by Goldman Sachs that have above-average tax rates has also outperformed the benchmark S&P 500 over the past week, though by a more mild 2.7%.
In addition, this domestic footprint means they’re relatively less exposed to global trade and therefore are less vulnerable to any ratcheting up of trade restrictions along the lines of what Trump has pledged. In March 2018, the month Trump unofficially launched his trade war against China, small caps outperformed large caps by about 4%.
Powder keg
But when a rotation in market leadership is this explosive, there’s more than just an evolution in conventional wisdom at play.
The initial conditions matter. The ratio between the price of the Russell 2000 and S&P 500 had approached levels not seen since the dot-com bubble. Positioning follows price; short interest in the Russell 2000 far outstripped either the S&P 500 or Nasdaq 100. Now, flows into ETFs that track US small caps have been massive.
Recent data from the CFTC indicates “the large cap part of the equity market has become quite crowded,” writes Lori Calvasina, head of global equity strategy at RBC Capital Markets, adding, “positioning in the mega cap growth trade had gotten too extreme again.”
The prior extended run of underperformance had left small caps as very cheap relative to their larger peers – even if you strip out the largest among them. The difference between the 12-month forward price to earnings ratios for the S&P 500 (excluding the top 100 stocks) and the S&P 600 Small Cap Index is near extreme wides.
“There is no obvious reason for the pre-tightening cycle valuation spread to be persistently wider between large and small caps ex monopolies,” writes Dennis Debusschere, chief market strategist and founder of 22V Research.
If light positioning and cheap valuations are the tinder, and changing inflation and political fortunes are the sparks, then the options market is certainly the kerosene.
The speculative, leveraged buying that was all too visible in the likes of Nvidia earlier this year is finding a new, very different home.
Call volumes – bullish options bets – tied to Nvidia have dwindled to their lowest level since January 2023. In their place, the five-day call volumes for the iShares Russell 2000 ETF have crescendoed to their highest level on record.
What now?
Investors are bringing out the same playbook from the fourth quarter of last year – and speed-reading through it.
The Russell 2000 Index bottomed in late October 2023 as the Federal Reserve was poised to shift from tightening to easing. In November and December, small caps effectively front-ran a rate-cutting cycle that has been delayed long past its expected start date. During this period, small caps gained as much as 26% – or a little more than twice as much as they’ve rallied in the past week alone.
This recent advance is so noteworthy for its speed and magnitude that it’s causing the normal relationship between performance and implied volatility to flip on its head.
Typically, the two are very negatively correlated, which is shorthand for how stocks tend to grind higher but fall precipitously.
But the five-session correlation between the Russell 2000 Index’s percent change and the net change in the Russell 2000 Volatility Index (which tracks the expected moves for the small cap benchmark over the next month) is the most positive on record and extremely close to 1 (which would be perfectly correlated). That’s a reflection, in part, of how intense the call-options demand has been.
The glass-half-full view here is that, well, there’s still more juice to squeeze – 26% is a lot less than 11%, and this rally has not just the Fed cuts angle going for it narrative-wise, but an extra political element to boot.
The glass-half-empty view would involve pointing out that, in aggregate, there’s much less Federal Reserve easing priced in compared to small caps’ December peak, implying less relief on interest expense going forward.
And the macro backdrop still implies this is more about wishcasting on small caps’ fundamentals rather than having solid grounds to expect improvements.
Neither Citi’s US economic data change index (which measures data relative to their one-year average) nor surprise index (which tracks data compared to economists’ expectations) has made a decisive inflection higher, with both well in negative territory. To be fair, however, RBC’s Calvasina did observe some nascent signs of support for small caps converging towards large caps based on recent earnings revisions.
And, of course, the political winds can shift.
“IWM is not a meme stock, it is not Tesla, it is most certainly not deserving of giga tech performance behavior,” writes Scott Murray, who runs the Smashing Volatility substack.
The market has shifted from lacking direction on one theme (AI) to very, very aggressively pricing in all the positives that could come from the type of expansionary fiscal policy we’d expect under a united Republican government as well as less restrictive monetary policy.
So the question for investors is: Now what? What’s the catalyst going forward?

