Smartphones are 12% cheaper than last year, according to the latest inflation data... except they’re not
Phones are one of a few important categories that get quality, or “hedonic,” adjustments in the Consumer Price Index — which make their price go down in the official statistics.
Measuring prices is easy, right? It’s right there on the sticker! Write it down in a big spreadsheet, come back in a month, write it down again, and voila — you are now tracking inflation.
Of course, it’s not quite that simple.
Before you even get to the writing it down part, a lot of legwork is needed to work out the right basket of stickers to track and how to weight them appropriately. And the fun part about doing the weighting work is that it is, of course, wrong for every single person; I, for example, probably spend more than 0.829% of my annual income on alcohol, but that is the weighting in the official index nonetheless.
But one of the hardest things about measuring inflation is that products change. If a $1 chocolate bar shrinks by 20%, but is still a buck to buy, we want that reflected in the index! If there are more sheets of toilet paper in my roll, for the same money, technically that got cheaper. This makes the Bureau of Labor Statistics’ job a lot harder — now they’re out here weighing chocolate bars and counting toilet paper sheets — but these are, at least, pretty sensible adjustments to make.
However, what if the new model of a car is safer in a crash, has 10 more horsepower, has brighter headlights, a better stereo, and is a bit comfier? What if the camera or processor in my iPhone is better than last year for the same amount of money? What if I buy a microwave for $50, which has a billion more settings (that I never use) than my parents’ microwave, which was also $50?
Do you adjust for those?
The answer, with the exception of the “comfiness” and stereo quality, in all of those cases is yes.
And that’s how you get smartphones registering as 12% cheaper in April 2026, compared to April 2025, in the latest Consumer Price Index print — because, when adjusted for feature parity, they are.
This leads to some pretty insane results. For example, according to the official CPI data for smartphones, prices (read: quality-adjusted prices) have dropped 65% since the start of 2020 in the United States.
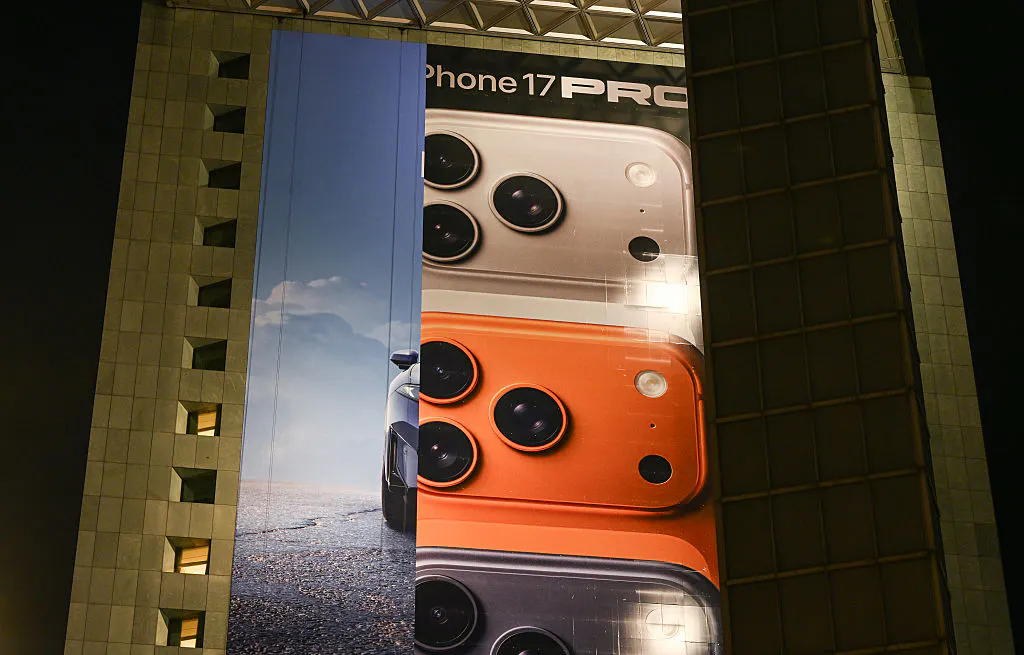
For comparison, the latest iPhone at the start of 2020 was the iPhone 11, which was yours for $699. Today, the iPhone 17 from Apple is $799 — not a crazy amount more, of course, but not exactly a 65% cut.
That’s the quality adjustments at play.
And, for what it’s worth, it’s hard to say that the adjustments are wrong. Nor are they trying to mislead — we really do have way better phones in our pockets for only slightly more money — it’s just that the inflation statistics are often wildly misunderstood.
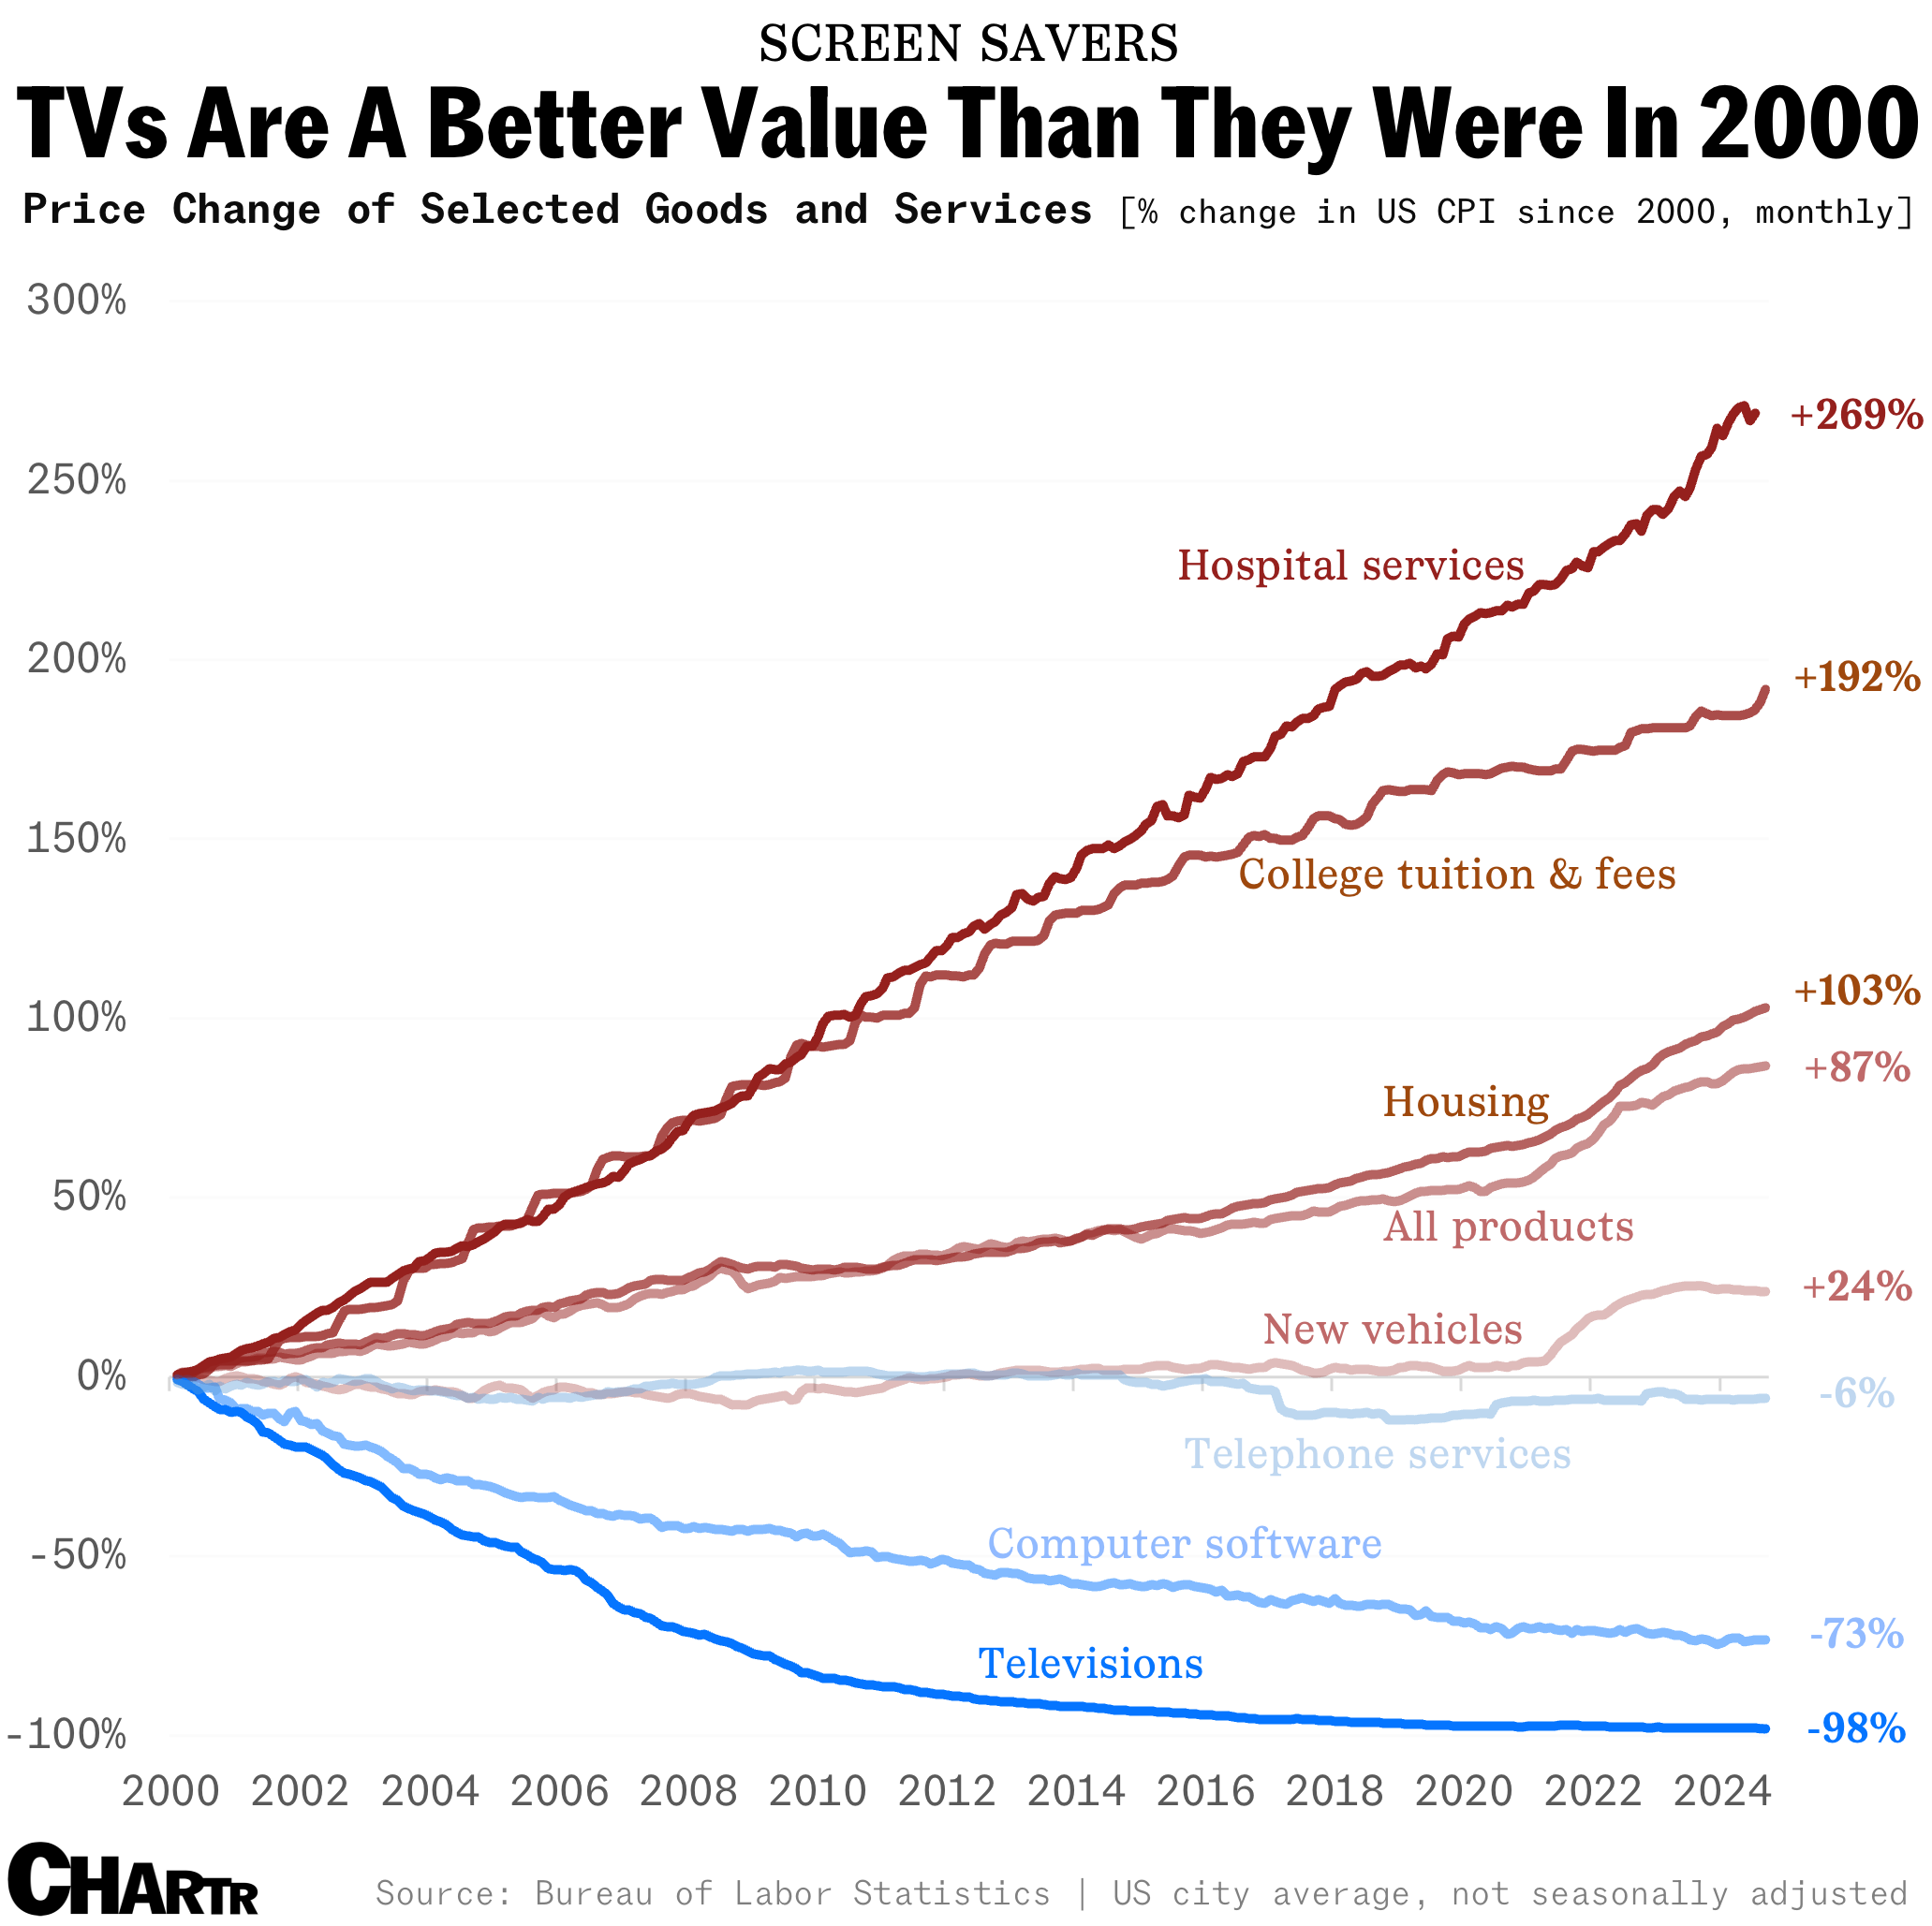
Go Deeper: TVs don’t actually cost 98% less than they used to... and other inflation misconceptions