


The top 5 charts to watch for 2025
Business spending on AI, the precarious US housing market, crypto’s growing power, megacap tech’s unique market structure, and the Federal Reserve outlook.
One of my favorite things about covering financial markets and the economy is that there’s never a shortage of critical charts to monitor, and what we’re paying the most attention to evolves dramatically over time. In 2015, the Baker Hughes weekly rig count was a much-watch for market participants amid the burgeoning oil glut and US industrial recession. In 2022, everyone was focused on how much Europe was able to build up its natural-gas inventories after Russia’s invasion of Ukraine.
Neither of those are on the front burner now, and many other key indicators have arisen in their place. With that in mind, we present our top five charts to watch for 2025 — the most important metrics and market relationships covering everything from AI spending to US housing to cryptocurrencies that we expect will play the biggest role in shaping the outlook of the US economy and financial-market performance.

Will capital spending on AI continue to boom?
Spending a whole lot of money on chips with the hopes of making a whole lot of money via AI has been the dominant strategy for most of America’s leading companies. Two noteworthy exceptions to this trend are Nvidia and Broadcom, which are designing chips that power the AI boom.
The AI-linked outlays from the S&P 500’s “hyperscalers” — Microsoft, Amazon, Alphabet, Meta, and Oracle — are estimated to total in the hundreds of billions in 2024, prompting shortages of the cutting-edge semiconductors to train and refine generative-AI models and a frenzied build-out of data centers to harness their power. This is a big source of current profits for some tech giants that’s giving another group of tech giants something to dream on (and start to enjoy).
Narratives around the merits of all this capital spending have evolved and shifted over time. But with every hyperscaler besides Microsoft handily outperforming the S&P 500 in 2024, it’s hard to argue that investors are overly pessimistic on the prospective return on investment.
Right now, a shorthand summary of investors’ view is that this is a case of throwing good money after good. This raises the risk that a negative turn in how much companies are willing to spend building out these new capabilities coincides with a more pessimistic view on the returns that will be generated from these capital outlays.
Of course a universe of more benign scenarios exists, including relatively uncorrelated outcomes from a correlated investment boom — that is, clear winners and losers. Or this tree of capex seemingly growing to the sky. But to quote the famous statistician and trader Nassim Taleb: “I've seen gluts not followed by shortages, but I've never seen a shortage not followed by a glut.”
Housing IS the business cycle
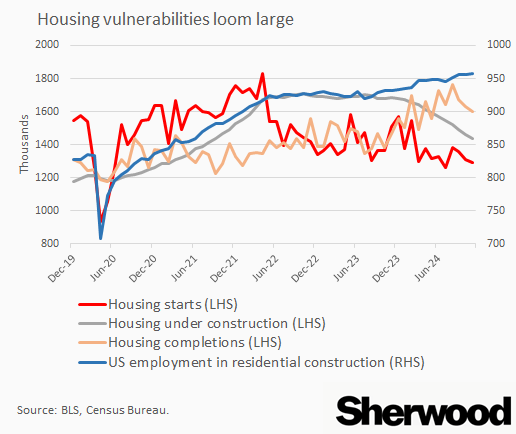
Monetary policy famously works with “long and variable lags.” It turns out these lags can be so long that, in the case of this cycle, policy tightening delivered in 2022 and 2023 threatens to weigh on employment in a key cyclical sector in 2025, even though the central bank flipped from raising interest rates to lowering them in the meantime.
Employment in residential construction stands at its highest level since the run-up to the global financial crisis. Meanwhile, housing starts have been in retreat in tandem with the number of units under construction. That does not bode well for future output from the sector.
In a world where prospective new buyers are deterred by high long-term interest rates, homebuilders are facing pressure on margins thanks in part to trying to subsidize some of this rate sticker shock, and with management of these firms warning of lower-than-expected deliveries in the first quarter of 2025, employment in residential construction stands out as a clear vulnerability for the US job market.
Given the old maxim “housing is the business cycle,” popularized by a well-timed 2007 paper by Ed Leamer of the same name, that means it’s an important flashpoint for the US economy and financial markets as well.
Homebuilders’ shares have not been holding up well lately, with the iShares US Home Construction ETF down 20% from its mid-October peak to its December trough.
Will crypto keep coining money?
I am not a bitcoin maxi; I have not had fun staying poor.
But crypto generally, and bitcoin specifically, sits at a busy intersection that includes government policy, retail enthusiasm, and growing institutional adoption.
The rise of crypto has clearly extended its influence beyond the asset class as narrowly defined, and it’s become more entrenched in the traditional financial system and publicly traded securities. Most famously MicroStrategy — but also Tesla, MARA Holdings, Hut 8, and reAlpha Tech — are treating cryptocurrencies as a kind of “reserve asset” for their firms.
Barclays analysts have argued that Tesla, a trillion-dollar company, is now best compared to cryptocurrencies. For 2024 as a whole, the stock’s daily moves have been roughly as correlated with bitcoin as they are with the fluctuations of its Magnificent 7 counterparts. And crypto played a not insignificant role in facilitating the change in stock-market leadership within tech from semiconductors to software after the US election.
Simply, bitcoin is as good a barometer as any for assessing optimism surrounding the incoming Trump administration in the financial realm, and the willingness of individuals as well as institutions to embrace risk. It’s a one-stop shop for assessing the vibes: you could monitor trading and options activity across a host of speculative pockets of the stock market, or just look at this preeminent crypto instead.
Can tech giants keep stock-market volatility suppressed?
Yes, when you’re the leaders of a cohort that’s greater than 40% of the S&P 500, you warrant getting two out of the five top charts to watch.
One hallmark of 2024 was the extremely low realized correlation among members of the so-called Magnificent 7 stocks. That is to say, on a daily basis, these stocks tended to march to the beat of their own drums, despite all operationally doing a similar thing: spending billions to enhance their AI functionality in their respective key business lines — while Nvidia, again, is just raking in these dollars.
It’s particularly noteworthy that Tesla is the chief driver of lower correlations as of late. The last time it was this much of a unique snowflake versus this group was when the stock traded in a range for three years, compared to going straight up after the election.
What were the consequences of this for the US stock market as a whole? Well, the implied and realized volatility of the S&P 500 is a function of how much individual stocks move and how much they tend to move in the same direction — that is, their correlation. The one-year rolling average of the one-month co-movement of the S&P 500’s top 50 constituents ended 2024 at a record low (based on data going back to 2011), and this phenomenon among the megacaps is a big reason why.
This dynamic has important implications for how much money some types of investors are willing to put into stocks. We live in a world where many hundreds of billions of assets under management are systematically tied to the volatility of what they own — so called vol-control funds or risk-parity strategies.
Whether due to a slide in the economy or some industry-specific common factor (say, a downward revision of the expected returns on AI investments), anything that raises the co-movement of tech giants is going to lower how much stock-market exposure those funds will have. And, as the clichéd line goes and the chart shows, in a crisis, correlations go to one.
How many Fed cuts are coming in 2025?
Pullbacks in the stock market have been rare, brief, and not too deep in the back half of 2024. But all 3% drops from the highs for the S&P 500 have come when markets either expect the Fed to cut a lot (early August and early September) or barely at all (late December). Should hot inflation prints in Q1 (which have been common in the past few years) push this number above 4.13% (i.e., doubting whether any easing will be delivered), that could prove a headache for stocks. Same story if any unwelcome cooling in the jobs market sends this yield sharply lower.
The sweet spot for market expectations on where the federal funds rate will sit at the start of 2026 is probably somewhere between 3.25% and 4%, a level that would imply inflation isn’t enough of a problem to prevent further easing, but any deceleration in growth or labor-market softness isn’t severe enough to warrant rapid, significant cuts.
In any event, where this metric trades is going to be a good lens into the market’s near-term outlook for NGDP growth (that is, real growth plus inflation). That’s critical for sales growth, which, with profit margins being as high as they are, offers very efficient fuel for earnings growth.